Stellar Lumens Price Prediction: XLM jumps 9% as the network’s utility skyrockets
- XLM is currently trading at $0.086 after a massive price spike towards $0.09.
- The main reason behind the recent move seems to be the participation in the IMF meeting from the CEO of Stellar.

The International Monetary Fund conducts annual meetings to discuss several pressing issues. This year, Denelle Dixon, CEO of Stellar, was invited to speak at the ‘Cross-Border Payments - The Private Sector Steps Up’. The main discussion revolves around emerging solutions and what do people expect from regulators and policymakers.
XLM aiming for $0.10 in the short-term
XLM is trading at $0.086 after a significant 9% price spike, which was initially fueled by the announcement of USDC joining the Stellar blockchain on October 15. The digital asset has seen a $300 million increase in its market capitalization over the past four days.
XLM/USD daily chart
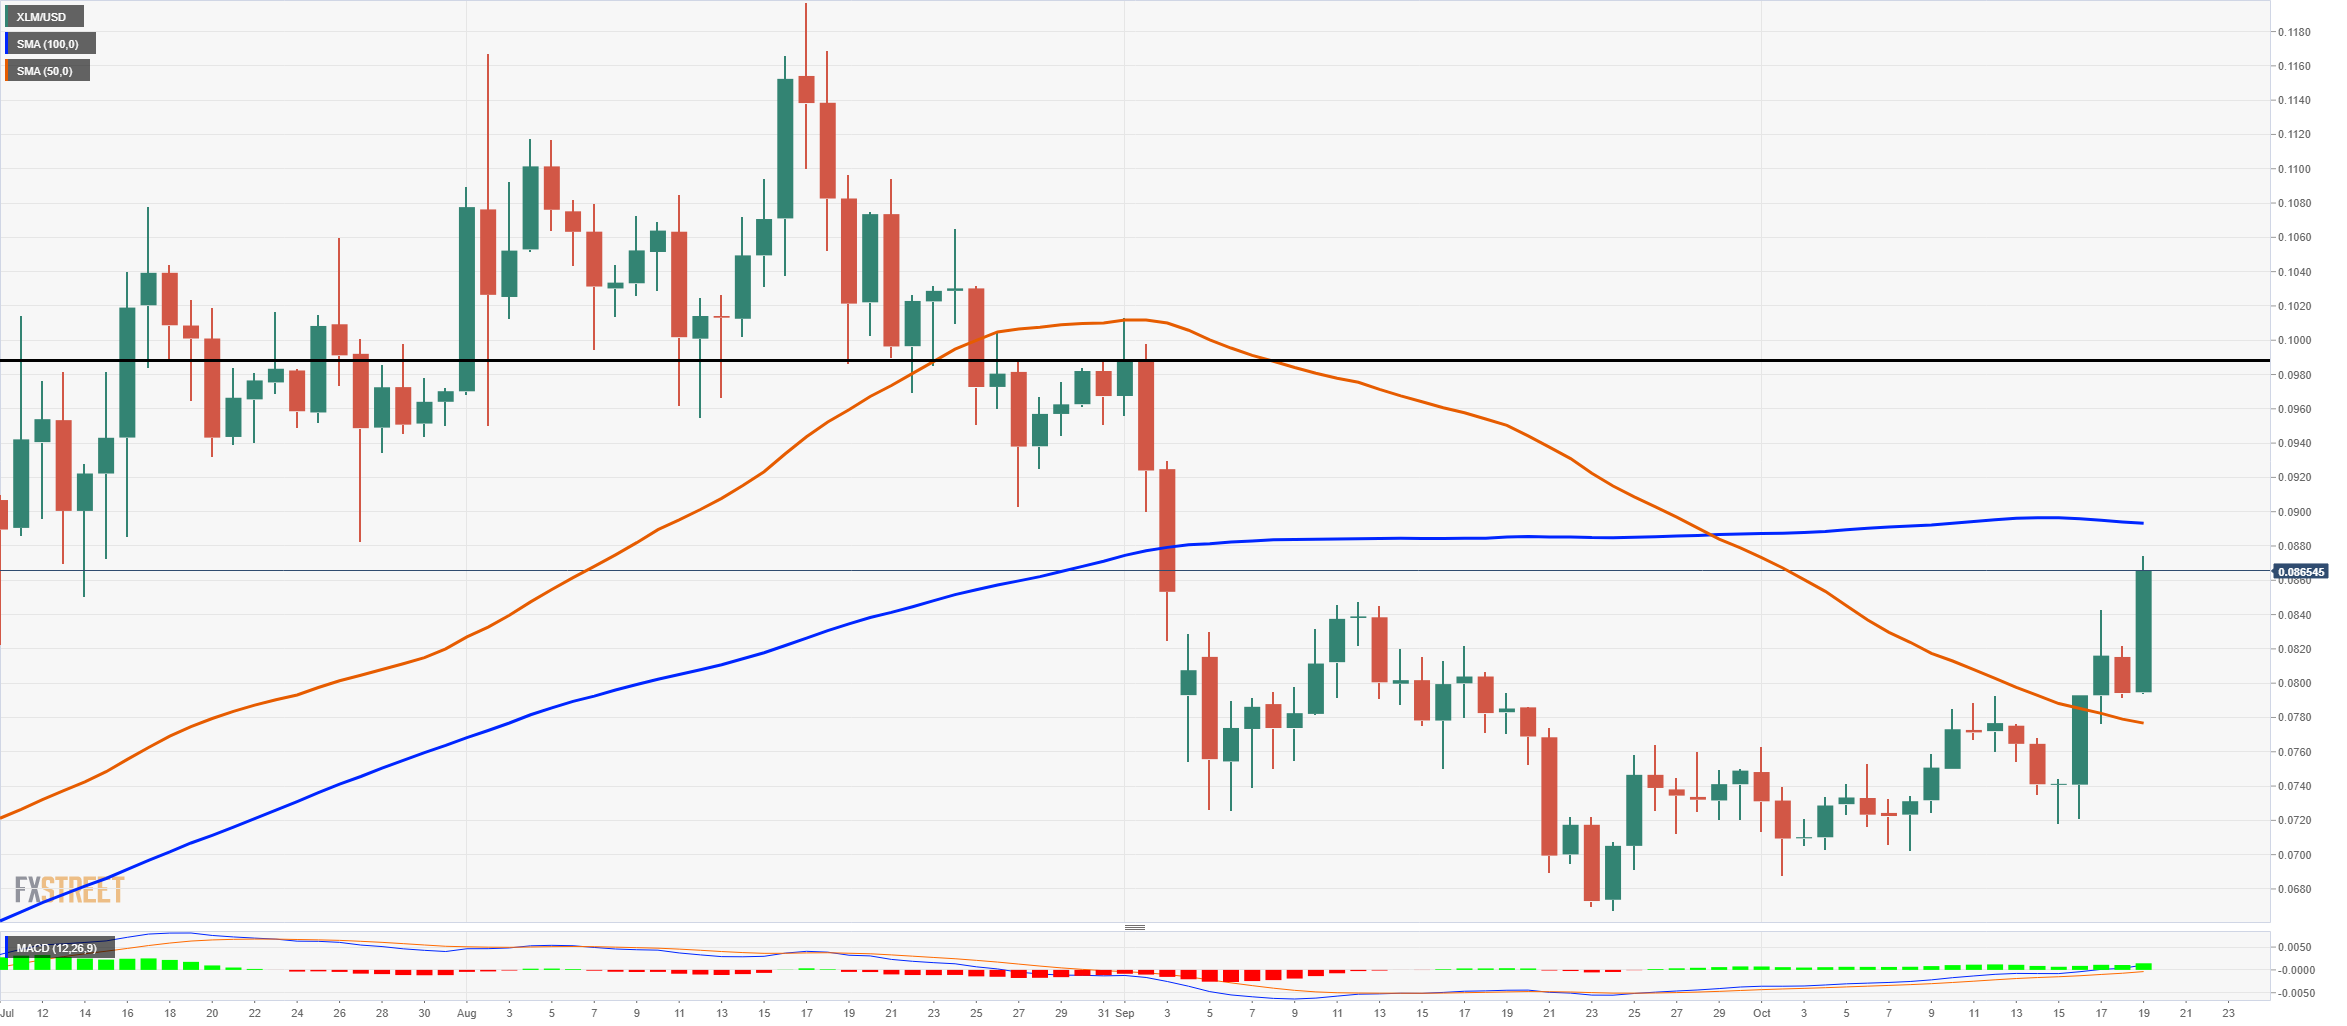
The digital asset is trading above the 50-SMA, which was turned into a support level. It seems that bulls are eying up the next resistance level, where the 100-SMA is located at $0.09. The MACD remains bullish on the daily chart, and it’s gaining strength.
XLM/USD 4-hour chart
-637387124875449441.png)
The initial jump on October 15 thanks to USDC was followed by a similar price move in the past 24 hours, probably thanks to Denelle Dixon, CEO of Stellar, joining the IMF meeting this year. The uptrend on the 4-hour chart is robust, and the next target price after $0.09 would be $0.1.
On the other hand, the significant resistance at $0.09, where the 100-SMA is currently standing, could pose a big threat to the bulls. Rejection from this level can easily push the digital asset down to a notable support level at $0.084, which was a resistance point tested on October 12.
Key price points to watch
To the upside, bulls are eying up the 100-SMA on the daily chart at $0.09. This is the next price target in the short-term. A breakout above this point can easily lead XLM towards $0.1, the next resistance level. The current momentum of Stellar seems to be strong enough for this to happen.
On the flip side, there are two resistance levels on the way up. Rejection from any of them can be a strong bearish indicator. Failure to climb above the 100-SMA at $0.09 can drive XLM towards the support level at $0.084 on the daily chart.
Author

Lorenzo Stroe
Independent Analyst
Lorenzo is an experienced Technical Analyst and Content Writer who has been working in the cryptocurrency industry since 2012. He also has a passion for trading.



