Solana Price Prediction: 8 out of 10 investors might be trapped at a loss
- Solana price shows 80% of traders went long during October prior to a 16% decline.
- Solana price: multiple reasons to watch out for sidelined bears as they may be enticed to enter the market soon.
- Invalidation of the bearish thesis comes from a break above $33.11.

Solana price is attempting s bullish retaliation since last weekend's 8% decline. Still, caution should be applied as the uptrend is not guaranteed.
Solana price may decline further
Solana price shows reasons to believe in additional sell-offs in the coming days. Solana, the centralized smart contract token, witnessed a 16% decline since October 10. Interestingly enough, on the same day, CoinGlass's Long-Short Ratio indicator showed the largest skew in over a month. According to the indicator, nearly eight of every ten traders opened a long position during the period.
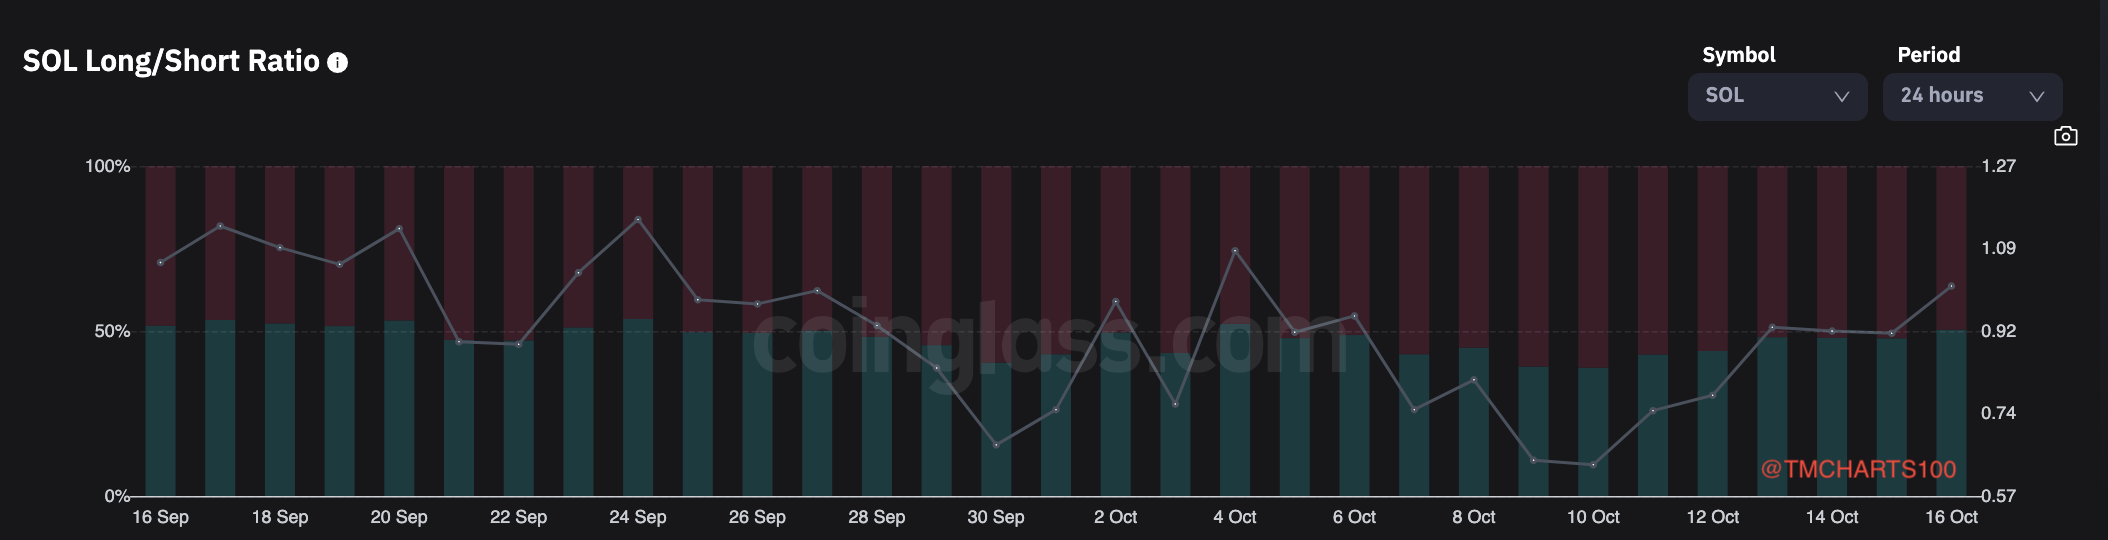
CoinGlass's Long vs. Short Ratio Indicator
Since the initial decline, the Volume Profile indicator has not shown comparable demand amongst buyers with regard to the bears’ previously induced decline. Thus, It is likely that bulls are still trapped in a losing position and holding on to the centralized smart token may become problematic.
Solana currently auctions at $30.99 as the bulls have produced a ramping-like pattern to start their fight-back after the 8% weekend decline. The move south was catalyzed after the 8-day Exponential Moving Average was rejected. The bulls have breached the 8-day but have yet to test it for support.
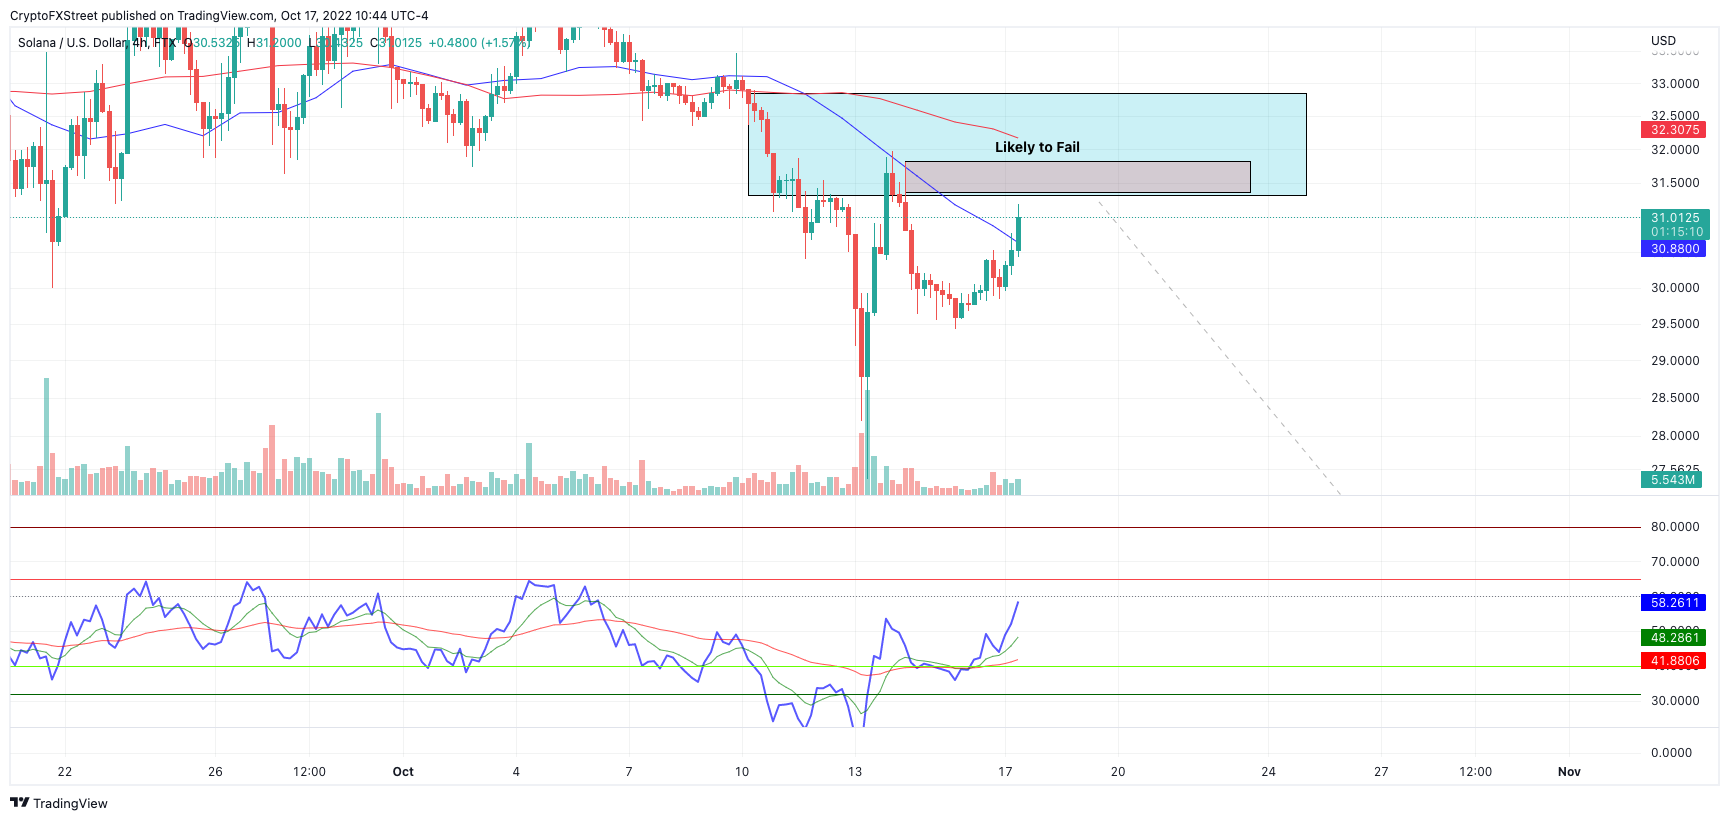
The Relative Strength Index is now in justifiable territory for sidelined bears to enter after falling slightly into oversold conditions during the weekend. Additionally, there is a bearish divergence between the current price and the Thursday night high at $31.81. If the market is genuinely bearish, sell signals should start presenting between $30 and $31.50. A bearish target could be the 2020 liquidity levels near $20, resulting in a 35% decline.
Invalidation of the bearish thesis would come from a breach of the October 10 high at $33.11. If the bulls manage to tag the invalidation level, another uptrend rally targeting $44 liquidity levels stands a fair chance of occurring. Such a move would result in a 19% increase from the current Solana price level.
In the following video, our analysts deep dive into the price action of Solana, analyzing key levels of interest in the market - FXStreet Team
Author

Tony M.
FXStreet Contributor
Tony Montpeirous began investing in cryptocurrencies in 2017. His trading style incorporates Elliot Wave, Auction Market Theory, Fibonacci and price action as the cornerstone of his technical analysis.




