- Solana price is auctioning within a consolidative range, likely to resolve with an explosive move.
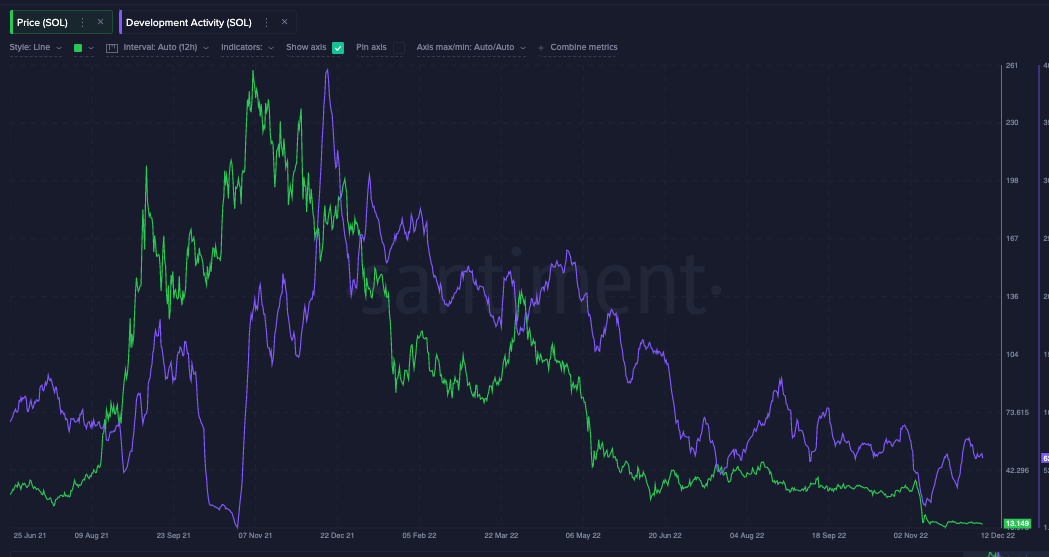
- The SOL network shows an uptick in development activity, which has previously played a role in price fluctuations.
- A break on either side of the coiling zone will result in a 15% swing.
Solana price is preparing for its next surge as price consolidates since November. Based on recent months, the SOL price leans more bearish. Still, the current range can squeeze out more gains. Key levels have been defined to assess a bullish and bearish scenario.
Solana price setting up shop
Solana price has endured ping-pong price action since the middle of November. On December 12, the centralized smart-contract token is bound to a range that has compressed from a 15% spread down to just 6% within three weeks. On smaller time frames, the congestion has day traders making hasty bets against one another while dually fighting for position with algorithmic trading bots.
Solana's price is currently trading at $13.12. On-chain metrics display the algo traders’ interest in SOL despite the waning liquidity. According to Santment's Development Activity indicator, the Solana network witnessed a 100% increase in development in the last three weeks. The metric calculates updates on Solana's GitHub Repository. GitHub is a medium for programmers, often algorithmic traders, to collaborate and share codes. The repository rose to 78 billion on September 6 from 35 billion on November 28.
Historically, Solana's Development Activity indicator has been rather timely, with sudden market selloffs correlated to influxes in development. On more than one occasion since September 2021, when the indicator doubled relative to its previous swing, the Solana price would sell off by more than 50%. These selloffs can be spotted on December 18, 2021, April 2, 2022, and August 24, 2022.
From a technical standpoint, the Solana price consolidation could lead to a 15% swing in either direction. The projection is based on classical price action techniques utilizing the largest spread within the current range. A break above the recent swing high at $14.43 could prompt a rally into the mid-$16 zone. On the contrary, a breach below the recent swing low at $12.82 could be the catalyst of a 15% decline toward the yearly low at $10.94.
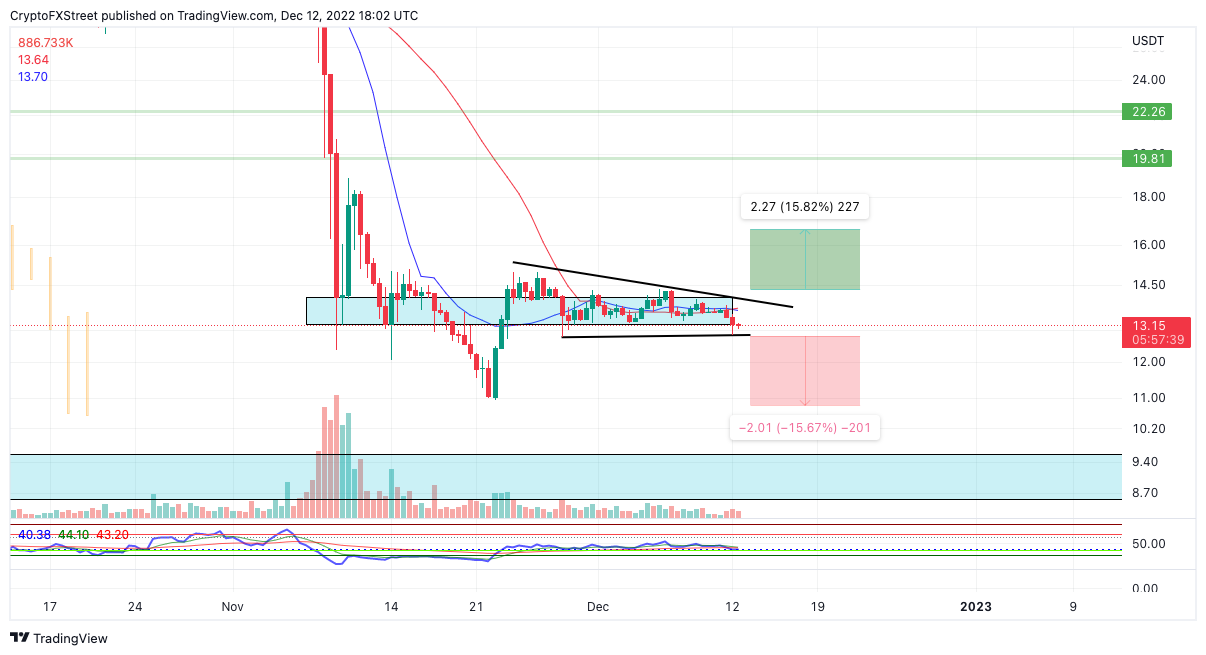
SOL/USDT 12-Hour Chart
Information on these pages contains forward-looking statements that involve risks and uncertainties. Markets and instruments profiled on this page are for informational purposes only and should not in any way come across as a recommendation to buy or sell in these assets. You should do your own thorough research before making any investment decisions. FXStreet does not in any way guarantee that this information is free from mistakes, errors, or material misstatements. It also does not guarantee that this information is of a timely nature. Investing in Open Markets involves a great deal of risk, including the loss of all or a portion of your investment, as well as emotional distress. All risks, losses and costs associated with investing, including total loss of principal, are your responsibility. The views and opinions expressed in this article are those of the authors and do not necessarily reflect the official policy or position of FXStreet nor its advertisers. The author will not be held responsible for information that is found at the end of links posted on this page.
If not otherwise explicitly mentioned in the body of the article, at the time of writing, the author has no position in any stock mentioned in this article and no business relationship with any company mentioned. The author has not received compensation for writing this article, other than from FXStreet.
FXStreet and the author do not provide personalized recommendations. The author makes no representations as to the accuracy, completeness, or suitability of this information. FXStreet and the author will not be liable for any errors, omissions or any losses, injuries or damages arising from this information and its display or use. Errors and omissions excepted.
The author and FXStreet are not registered investment advisors and nothing in this article is intended to be investment advice.
Recommended Content
Editors’ Picks

Bitcoin retail traders remain fearful, here’s why BTC could test all-time high
Bitcoin retail traders and small wallet holders reduce their holdings amidst fear of a steeper correction in the largest cryptocurrency by market capitalization. BTC price consolidates below the $100,000 level on Thursday, erasing less than 2% of its value on the day.

US states push for Bitcoin reserves, could buy $23B in BTC
A total of 20 US states are pushing for Bitcoin Reserves, with some proposals already moving forward. If these bills pass, they would require $23 billion in Bitcoin purchases, creating significant demand.

Ripple's XRP eyes a recovery as investors switch toward accumulation
XRP investors have been accumulating following an uptrend in the Mean Coin Age metric. However, the XRP derivatives market is yet to recover from a 30% open interest decline in the past week.

Ethereum could see a boost as Cboe files for 21Shares to begin staking within its ETH ETF
Ethereum (ETH) could be set for increased demand in the coming months following Cboe BZX 19b-4 filing with the Securities & Exchange Commission (SEC) to enable staking for the 21Shares Core Ethereum exchange-traded fund (ETF).

Bitcoin: BTC shows weakness, bears aiming for $90,000 mark
Bitcoin price hovers around $97,000 on Friday after losing nearly 5% in the last three days. CryptoQuant weekly report shows that activity on the Bitcoin network has declined to its lowest level in a year.

The Best Brokers of the Year
SPONSORED Explore top-quality choices worldwide and locally. Compare key features like spreads, leverage, and platforms. Find the right broker for your needs, whether trading CFDs, Forex pairs like EUR/USD, or commodities like Gold.