Solana Price Forecast: SOL could break above $190 as network activity rises


Solana price today: $176

  • Solana price corrects from Tuesday’s high above $183 after rallying alongside Bitcoin.
  • The number of unique active wallets has doubled in the past five days, according to on-chain data.
  • SOL could gain nearly 9%, breaking above the $190 level, according to technical indicators.

Solana (SOL) loses 2% on Wednesday, putting an end to a four-day rally fuelled by Bitcoin’s (BTC) sharp rise to almost a fresh all-time high. Despite the correction, the outlook for SOL remains positive, on-chain data and technical indicators show, adding to the chances that the recent uptrend could continue toward $190.  

These catalysts could push Solana higher

On-chain metrics such as the volume of SOL traded, the number of transactions and the number of unique active wallets (UAW) have increased in the past five days, according to data from DappRadar. 

Volume climbed from $126.46 million on October 26 to $163.09 on October 29. It peaked on October 25 at $341.1 million. 

As for transactions, increased from 17.4 million on October 24 to 19.2 million, while UAW more than doubled from 3.06 million to 6.19 million in the same period. Typically, an increase in active wallets within a short period of time is a sign of rising interest and demand from traders. 

UAW

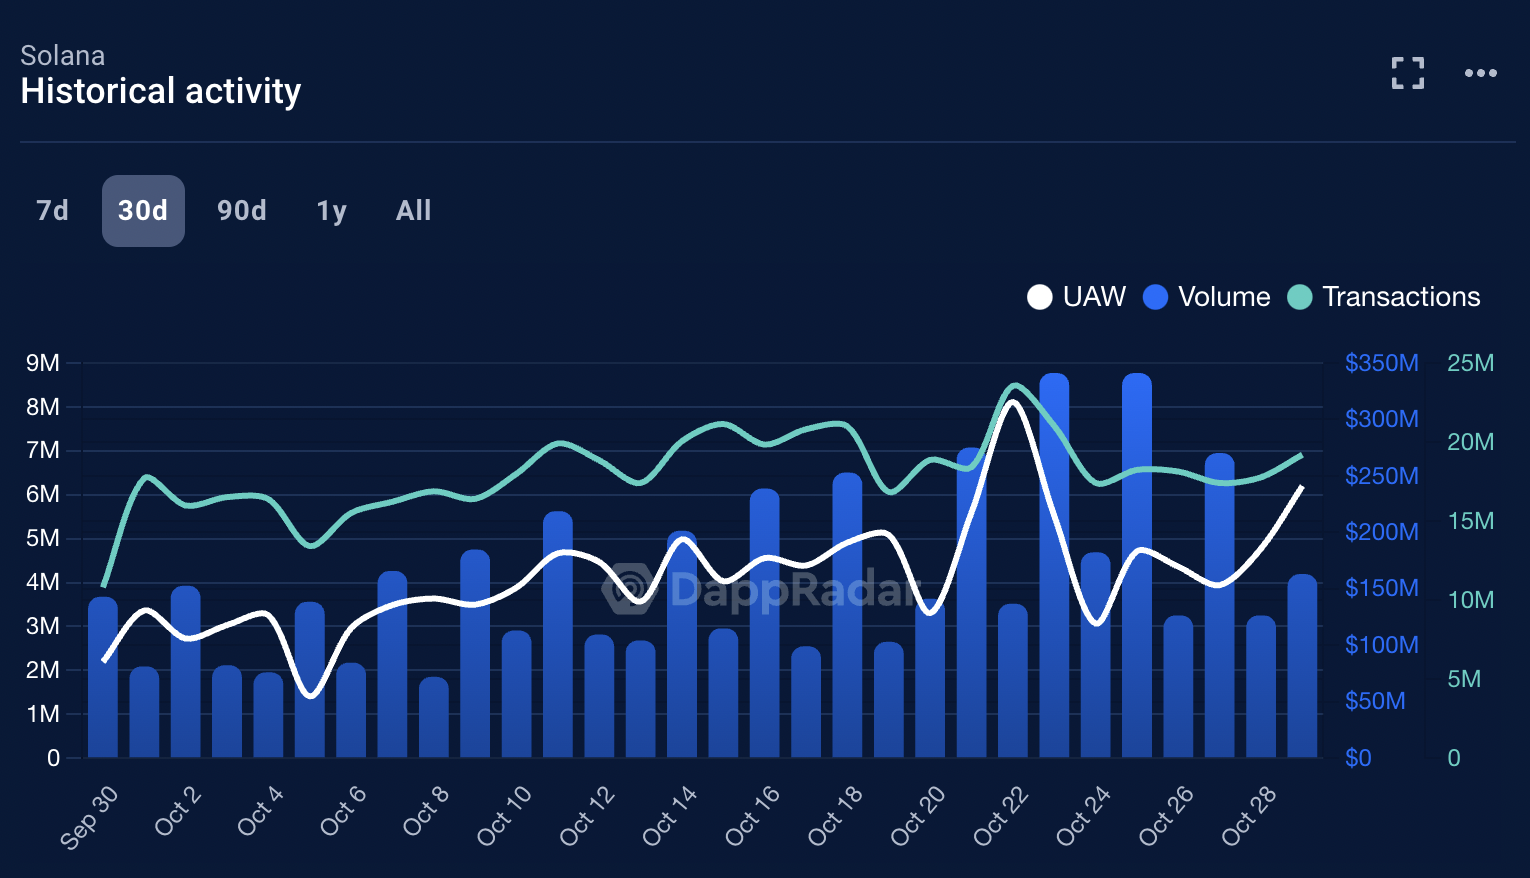
UAW, Volume and Transactions in the Solana network. Source: DappRadar 

Solana Price Forecast: SOL could add 9% gain

Solana price is in a clear uptrend in October. SOL climbed to a three-month high of $183.38 on Tuesday but corrected thereafter. 

If the uptrend persists, SOL could target the lower boundary of the Fair Value Gap (FVG) between $193.69, a 9% increase from the current levels, and $192.24. 

The Moving Average Convergence Divergence (MACD), a momentum indicator, shows green histogram bars above the neutral line. This implies that there may be positive underlying momentum in SOL price trend. 

Traders need to watch this indicator closely, if the histogram bars turn red and appear under the neutral line, it could indicate a reversal in the asset’s price trend. 

Solana

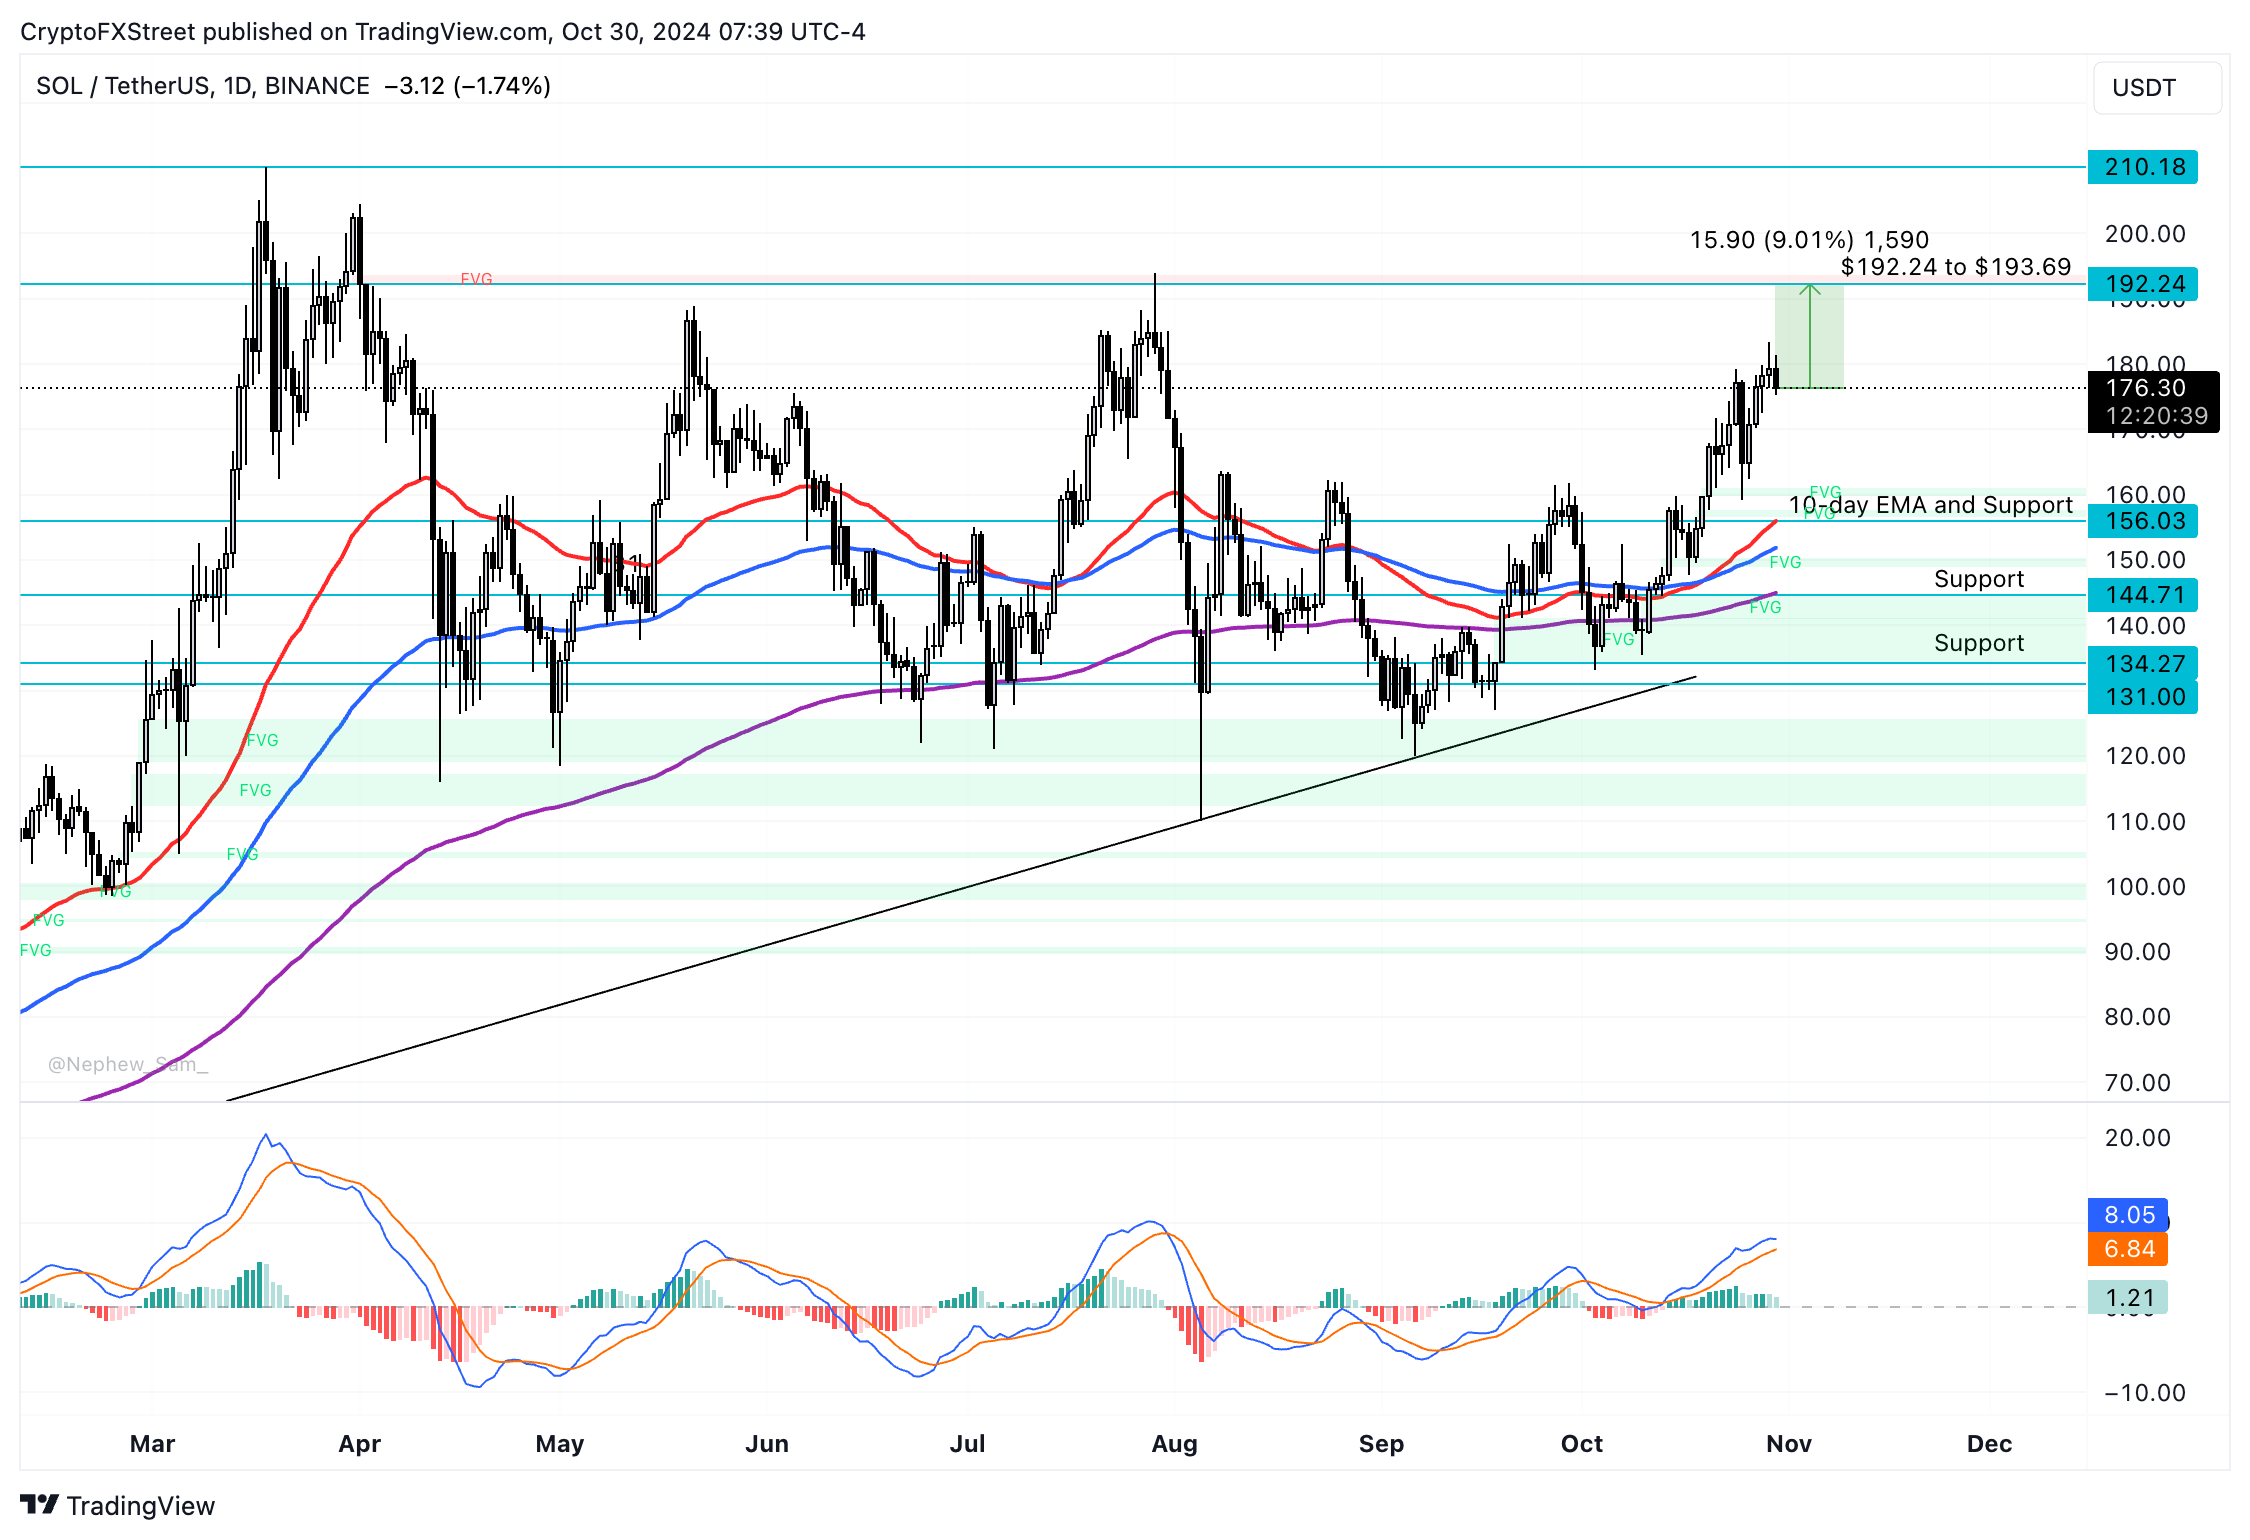
SOL/USDT daily chart

If the recent correction becomes a more pronounced pullback, Solana could find support at the 10-day Exponential Moving Average (EMA) at $156.03. 


Information on these pages contains forward-looking statements that involve risks and uncertainties. Markets and instruments profiled on this page are for informational purposes only and should not in any way come across as a recommendation to buy or sell in these assets. You should do your own thorough research before making any investment decisions. FXStreet does not in any way guarantee that this information is free from mistakes, errors, or material misstatements. It also does not guarantee that this information is of a timely nature. Investing in Open Markets involves a great deal of risk, including the loss of all or a portion of your investment, as well as emotional distress. All risks, losses and costs associated with investing, including total loss of principal, are your responsibility. The views and opinions expressed in this article are those of the authors and do not necessarily reflect the official policy or position of FXStreet nor its advertisers. The author will not be held responsible for information that is found at the end of links posted on this page.

If not otherwise explicitly mentioned in the body of the article, at the time of writing, the author has no position in any stock mentioned in this article and no business relationship with any company mentioned. The author has not received compensation for writing this article, other than from FXStreet.

FXStreet and the author do not provide personalized recommendations. The author makes no representations as to the accuracy, completeness, or suitability of this information. FXStreet and the author will not be liable for any errors, omissions or any losses, injuries or damages arising from this information and its display or use. Errors and omissions excepted.

The author and FXStreet are not registered investment advisors and nothing in this article is intended to be investment advice.

Recommended content


Recommended Content

Editors’ Picks

Why Solana, XRP, Dogecoin and BNB are crashing?

Why Solana, XRP, Dogecoin and BNB are crashing?

Solana (SOL), XRP, Dogecoin (DOGE) and Binance Coin (BNB) decline on Tuesday. Top altcoins ranked by market capitalization are in a downward trend, even though Bitcoin (BTC) continues to consolidate around the $95,000 level. 

More Cryptocurrencies News
Bitcoin Price Forecast: BTC consolidates as options market awaits policy clarity

Bitcoin Price Forecast: BTC consolidates as options market awaits policy clarity

Bitcoin (BTC) has been consolidating between $94,000 and $100,000 for nearly two weeks, with reports from Bitfinex indicating increased macro-correlation and maturity as a risk asset.

More Bitcoin News
Real-World Assets outperform the AI sector in the crypto market over the past month

Real-World Assets outperform the AI sector in the crypto market over the past month

Real-World Assets (RWAs) outperformed the Artificial Intelligence (AI) sector in the crypto market over the past month, with a weighted average gain of 15.6% in January. 

More Cryptocurrencies News
Storj Price Forecast: Bulls aiming for double-digit gains

Storj Price Forecast: Bulls aiming for double-digit gains

Storj (STORJ), an open-source platform that leverages the blockchain to provide end-to-end encrypted cloud storage services, continues to trade higher by 4.4%, around $0.39 on Tuesday after rallying 5% the previous day.

More Cryptocurrencies News
Bitcoin: BTC consolidates before a big move

Bitcoin: BTC consolidates before a big move

Bitcoin price has been consolidating between $94,000 and $100,000 for the last ten days. US Bitcoin spot ETF data recorded a total net outflow of $650.80 million until Thursday.

Read full analysis
The Best Brokers of the Year

The Best Brokers of the Year

SPONSORED Explore top-quality choices worldwide and locally. Compare key features like spreads, leverage, and platforms. Find the right broker for your needs, whether trading CFDs, Forex pairs like EUR/USD, or commodities like Gold.

Read More

BTC

ETH

XRP