Solana price today: $180.79
- Solana price increases for a fourth straight day, hitting the $180 resistance for the first time in nearly three months.
- Active addresses on the Solana blockchain have consistently climbed every month in the past year.
- SOL's upside target is at around $210, its 2024 high seen in March.
Solana (SOL) price climbs for the fourth consecutive day on Tuesday to an almost three-month high above $180. Active addresses on the Solana network are increasing sharply on a monthly basis, suggesting rising demand for the chain among traders and further supporting the optimistic price outlook for its native token.
Solana sees massive spike in monthly active addresses
The number of active addresses on a blockchain counts the number of wallet addresses that were active either as receivers or senders on a specific blockchain.
The monthly count of active addresses on Solana shows a significant gain, according to data from The Block, particularly in the last few months. In October, the metric climbed to 107.04 million. The chart shows the information as incomplete, since there are two more days left for the month to end.
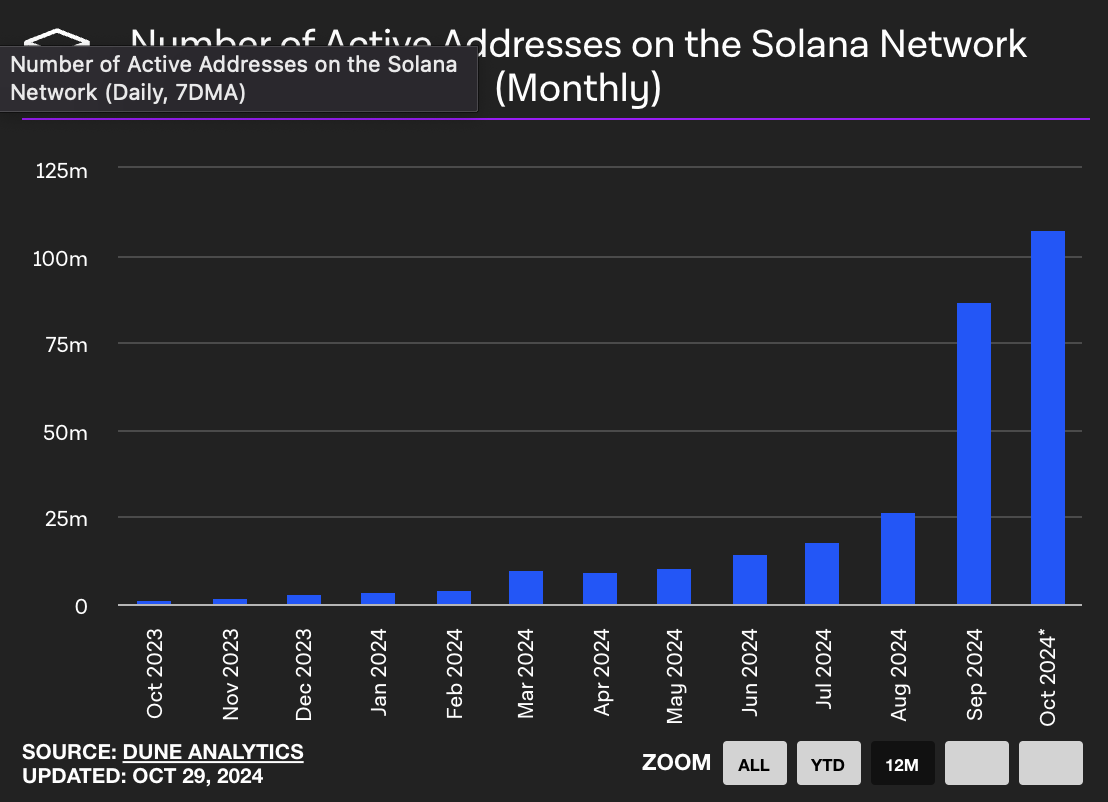
Number of active addresses on the Solana Network in the last twelve months. Source: The Block
On a daily basis, the number of total active addresses was at around 2.68 million on Sunday, down from its October 22 peak of 8.81 million, according to Dune Analytics data. The spike on October 22 can likely be attributed to meme coin activity and transactions on decentralized exchanges in the Solana network.
Solana Price Forecast: SOL could revisit March peak
Solana has been on a clear uptrend since the beginning of October. The altcoin is testing resistance at the psychologically important $180 level on Tuesday, and a daily close above it could pave the way for the token to reach the 2024 peak of $210.18 seen on March 18.
A rally to $210.18 would mark a 16% price increase from current levels. On the way to that target, SOL faces resistance in the Fair Value Gap (FVG) extending between $192.24 and $193.69.
The Moving Average Convergence Divergence (MACD), a momentum indicator, shows green histogram bars above the neutral line, signaling positive underlying momentum in SOL price trend.
Meanwhile, the Relative Strength Index (RSI) on the daily chart is at 68, close to overbought levels, suggesting higher chances of a corrective pullback if it enters the area above 70.
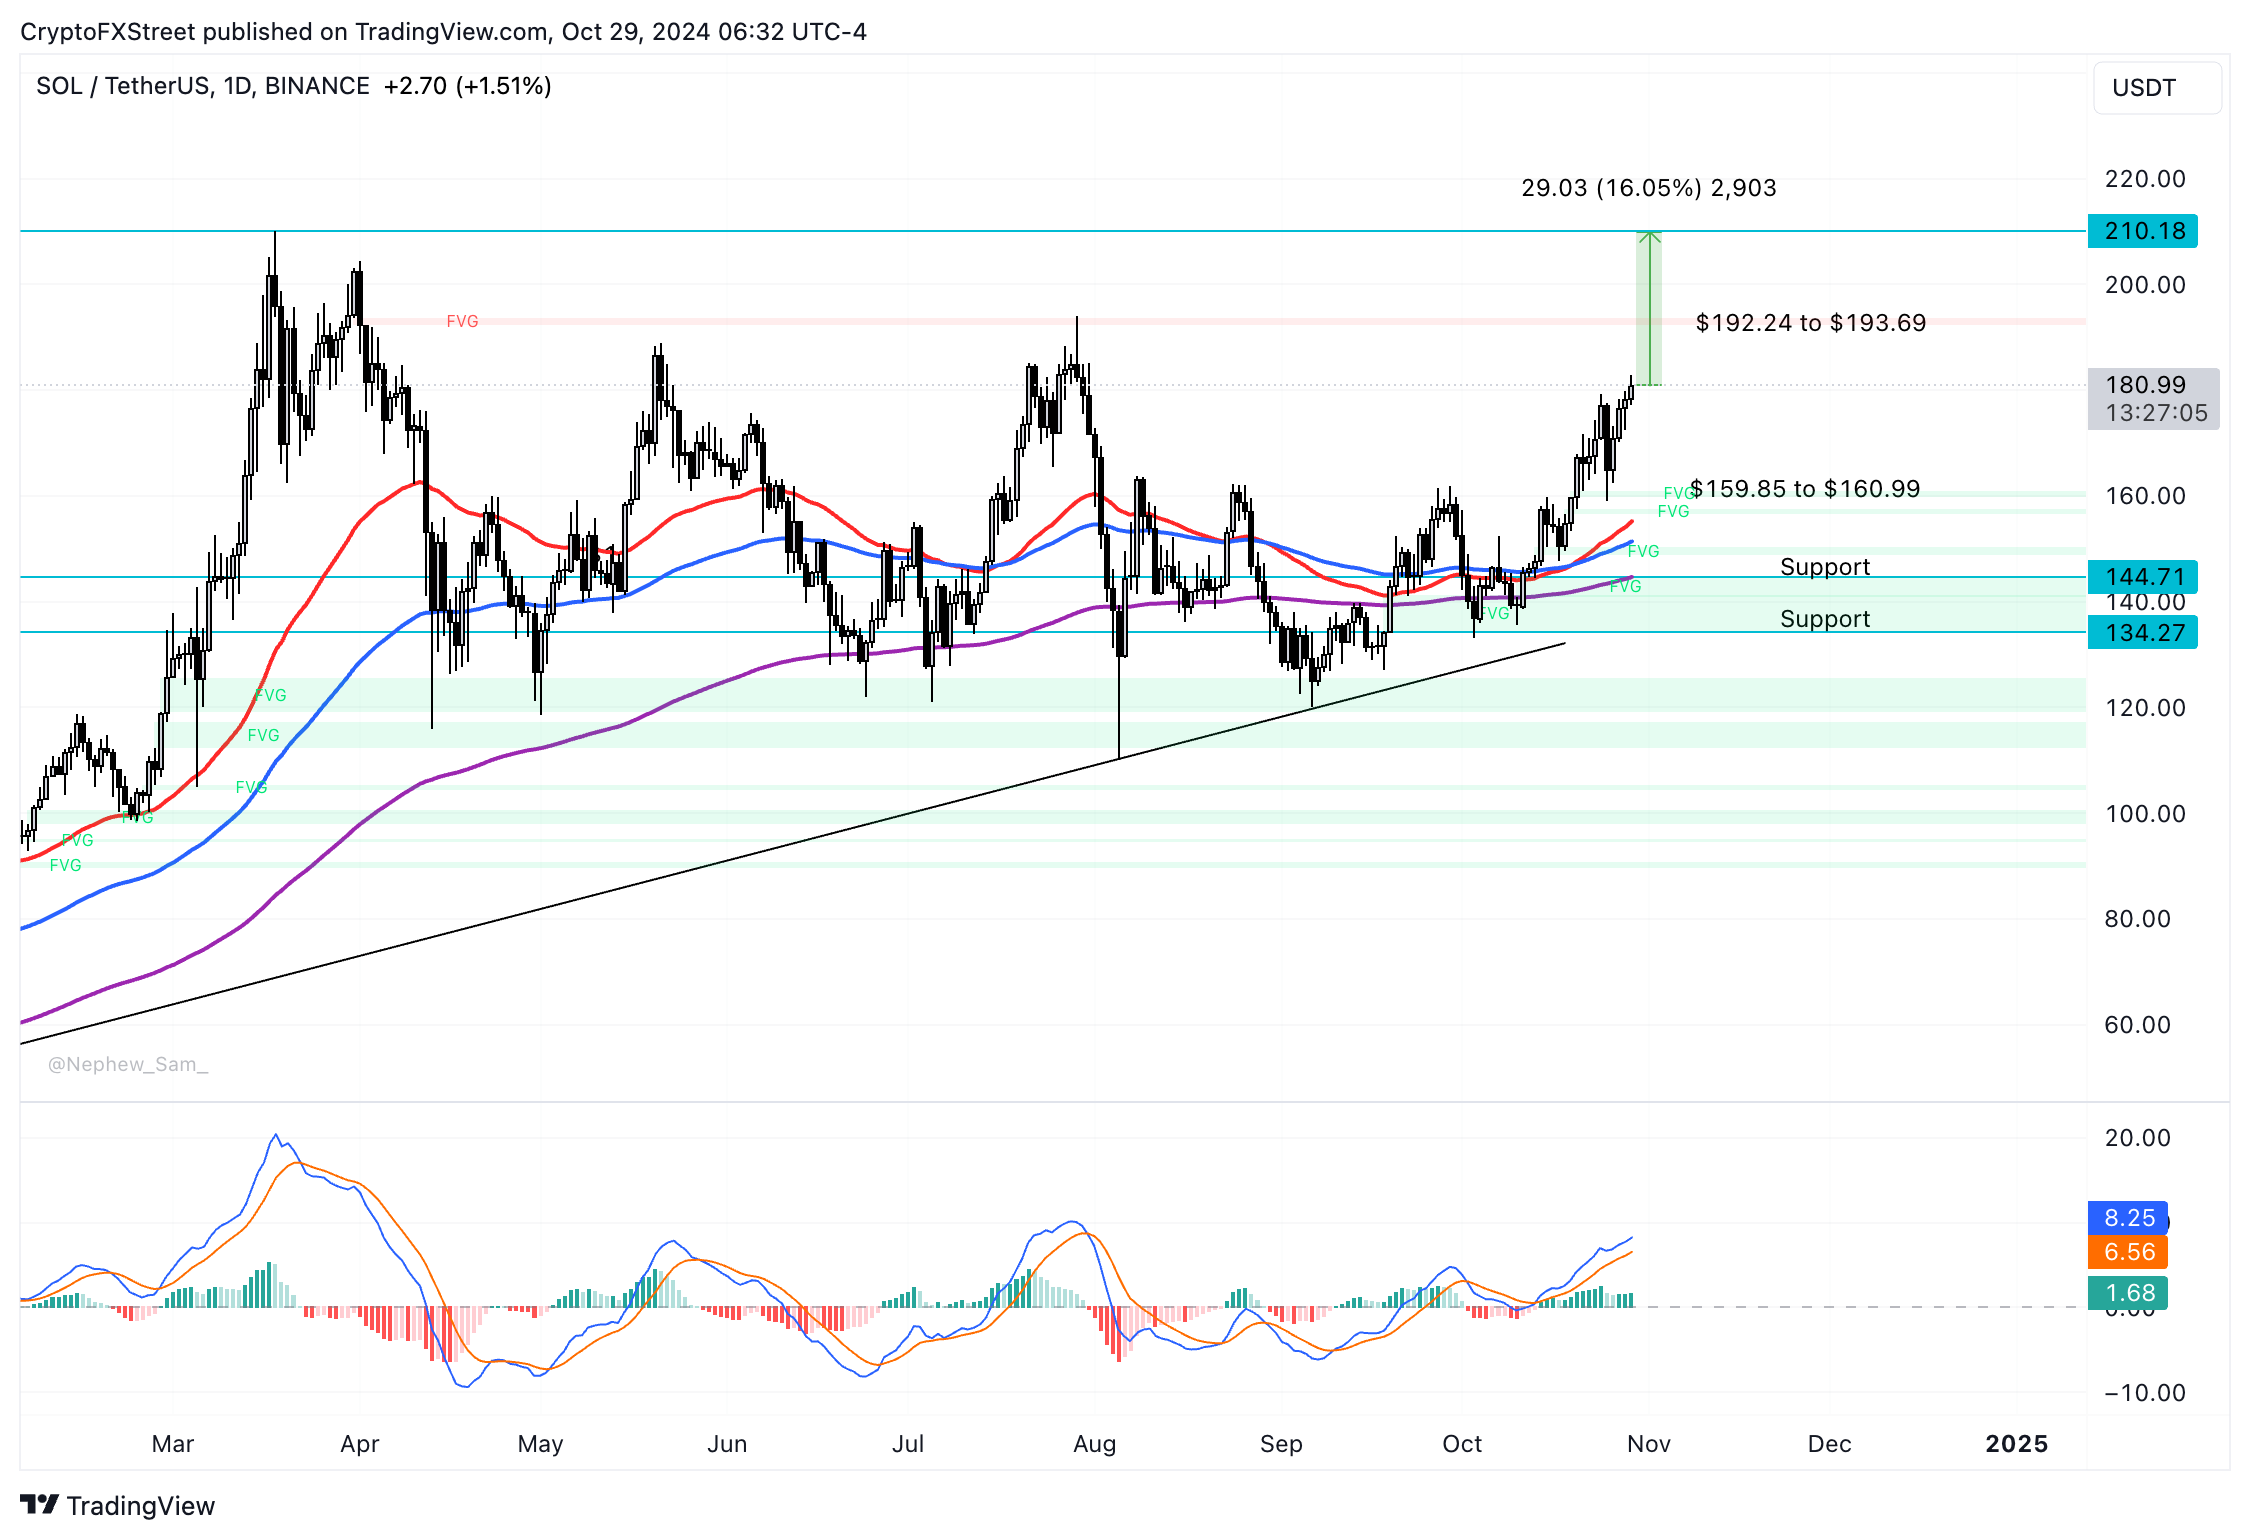
SOL/USDT daily chart
If Solana suffers a decline, the altcoin could sweep liquidity in the FVG between $159.85 and $160.99, as seen on the daily price chart. Other key support levels are the Exponential Moving Averages (EMAs) and the upper and lower boundaries of imbalance zones at $144.71 and $134.27.
Information on these pages contains forward-looking statements that involve risks and uncertainties. Markets and instruments profiled on this page are for informational purposes only and should not in any way come across as a recommendation to buy or sell in these assets. You should do your own thorough research before making any investment decisions. FXStreet does not in any way guarantee that this information is free from mistakes, errors, or material misstatements. It also does not guarantee that this information is of a timely nature. Investing in Open Markets involves a great deal of risk, including the loss of all or a portion of your investment, as well as emotional distress. All risks, losses and costs associated with investing, including total loss of principal, are your responsibility. The views and opinions expressed in this article are those of the authors and do not necessarily reflect the official policy or position of FXStreet nor its advertisers. The author will not be held responsible for information that is found at the end of links posted on this page.
If not otherwise explicitly mentioned in the body of the article, at the time of writing, the author has no position in any stock mentioned in this article and no business relationship with any company mentioned. The author has not received compensation for writing this article, other than from FXStreet.
FXStreet and the author do not provide personalized recommendations. The author makes no representations as to the accuracy, completeness, or suitability of this information. FXStreet and the author will not be liable for any errors, omissions or any losses, injuries or damages arising from this information and its display or use. Errors and omissions excepted.
The author and FXStreet are not registered investment advisors and nothing in this article is intended to be investment advice.
Recommended Content
Editors’ Picks

Hyperliquid risks breaking $40 support after correction from all-time high
Hyperliquid risks breaks below $40.00 support after reaching new record highs of $45.72 on Monday. Increasing volumes, coupled with a sharp decline in the derivatives market's Open Interest, suggest a decline in interest in HYPE as liquidations mount.

Crypto Today: Bitcoin, Ethereum, XRP broadly stall as Middle East tensions keep markets on edge
Bitcoin’s price action remains relatively muted below $107,000 as tensions in the Middle East thaw. US President Trump leaves the G7 meeting early, calls for the evacuation of Tehran amid uncertainty in global markets.

Cardano Price Forecast: ADA eyes further losses amid triangle fallout
Cardano trades in the red by over 1% at press time on Tuesday, extending its losses from the previous day. Shrugging off the recent announcement of the revised stake pool incentive scheme by Input/Output firm, pressure mounts over Cardano, with optimism in ADA derivatives declining.

Bitcoin falls slightly as Trump calls security advisors to deal with Iran-Israel war
Bitcoin price declines slightly to around $106,000 on Tuesday following a mild recovery the previous day. Donald Trump leaves the G7 summit early to return to Washington and meet with his national security team.

Bitcoin: BTC could slump to $100K amid Trump-Musk tussle
Bitcoin (BTC) tumbled to a low of $101,095 on Friday amid volatility in the market. The effect of the tussle between United States (US) President Donald Trump and Tesla Chief Elon Musk negatively influenced the NASDAQ and Tesla's stock price on Thursday, although both are recovering on Friday.