Solana Price Forecast: Bearish sentiment retreats as price gets close to key leverage levels
- Margin levels among SOL traders have increased, with significant trading activity around the $159 support level and the $165 resistance.
- On-chain data and technical analysis show that SOL’s bearish trend is losing steam.
- SOL’s long-to-short ratio is currently at 1.07, the highest level in two weeks.

Solana (SOL) rebounds on Tuesday after six consecutive sessions of losses as price action tests a critical breakout level at the $160-$165 region from a technical point of view. The increased levels of leverage among traders and momentum indicators suggest that bearish momentum is fading, increasing the likelihood of a further recovery in the short term.
Still, any chance of a rally hinges on the outcome of the US presidential election, which is set to influence the broader crypto market.
Current liquidation levels signal potential volatility for Solana
Solana traders are highly over-leveraged at the key liquidation levels, both on the downside at around $159 and on the upside at the $165 region, according to data from CoinGlass.
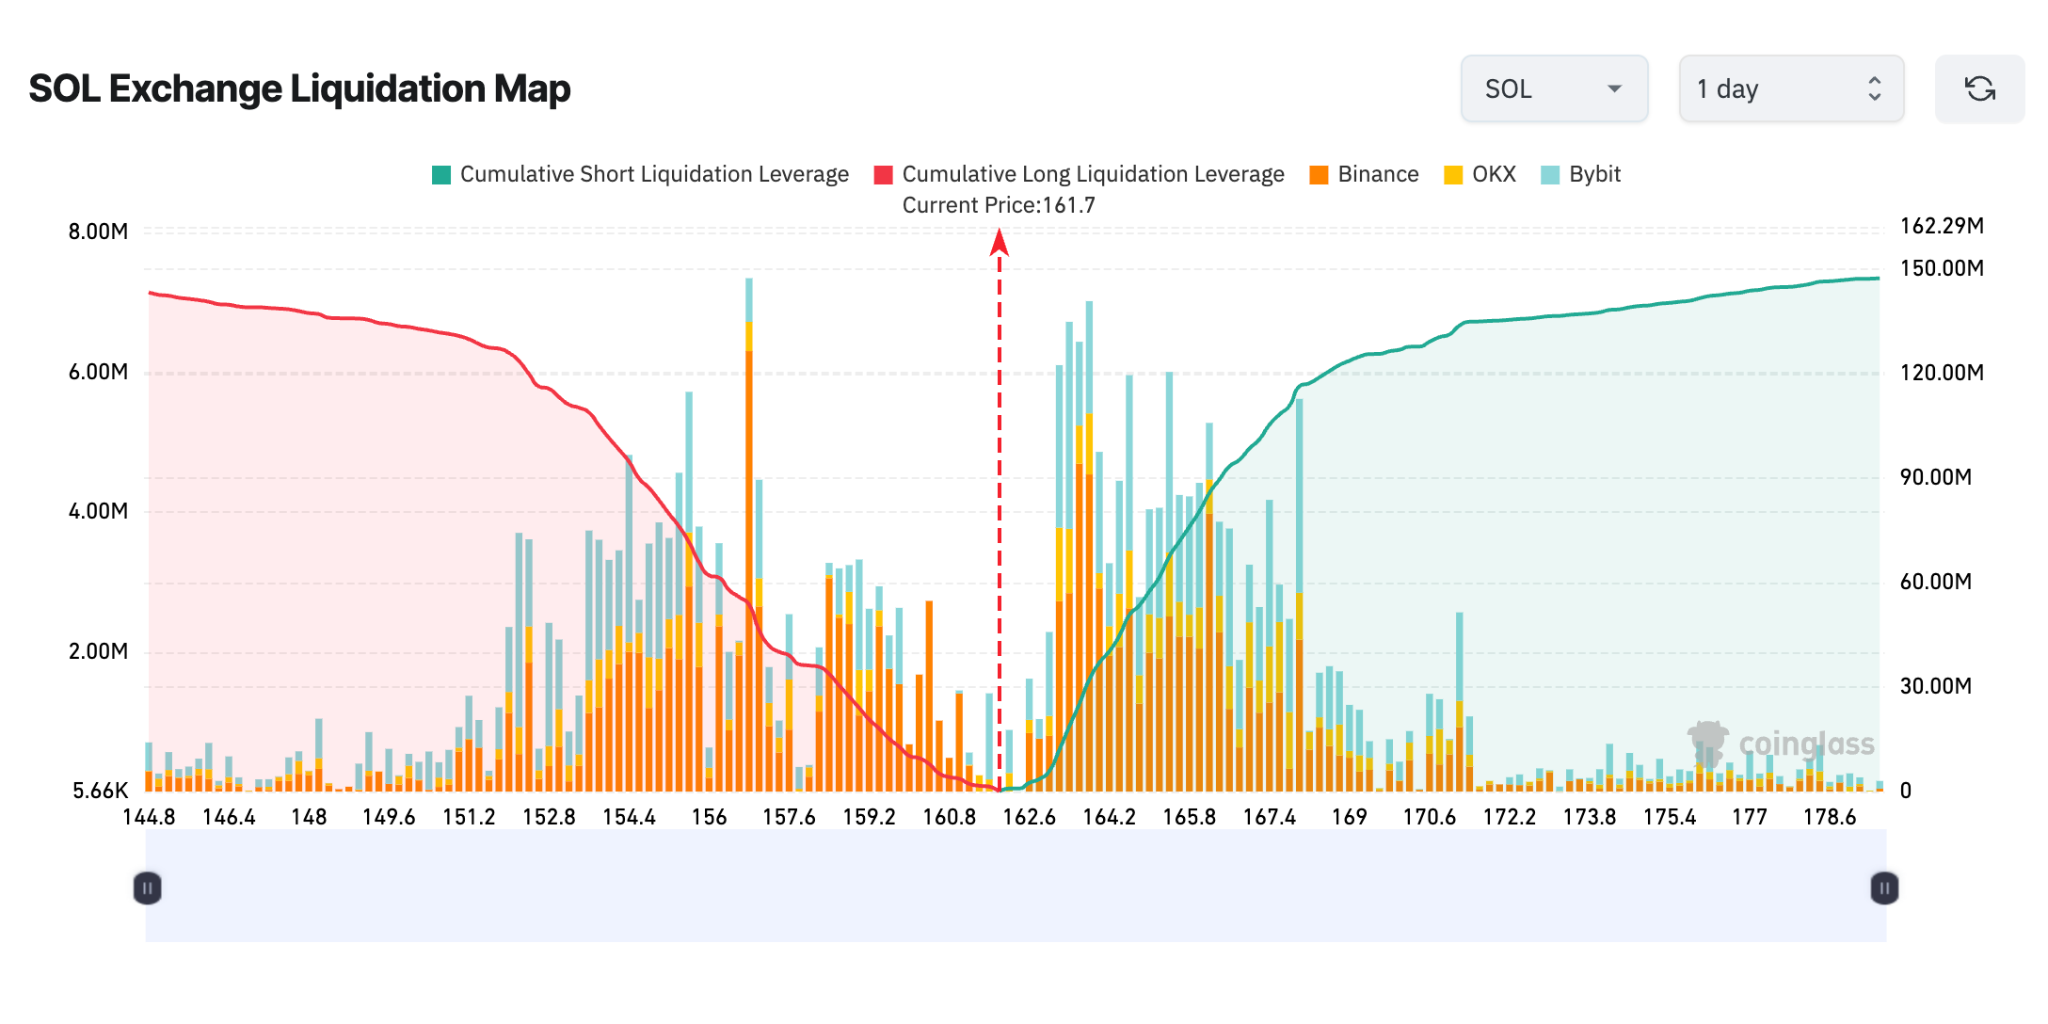
SOL Exchange Liquidation Map. Source: Coinglass
The fact that strong liquidation levels on the upside (right side of the graph) are closer and more elevated compared with those below the current price level of $162 (left side of the graph) suggests that bulls are close to conquering a key resistance level.
If these short positions surrounding the $165 are liquidated, this could help support a potential Solana price rally.
Other on-chain metrics also show some hope for SOL's price outlook. SOL’s long-to-short ratio is at around 1.07, the highest level since October 14 and the first time it has flipped above the neutral level of 1 since October 29, CoinGlass data shows.
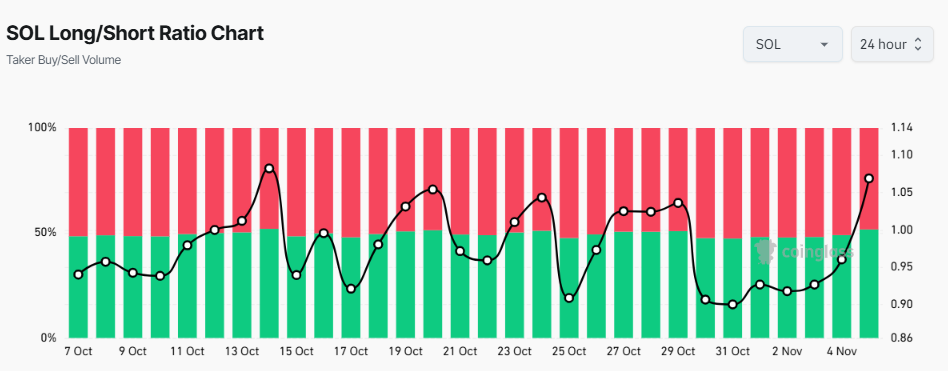
SOL Long/Short Ratio Chart - 24-hour. Source: Coinglass
Open Interest within SOL is also picking up, by 1.7% in the last 24 hours, in a sign that money is flowing back.
Solana Price Forecast: Bullish momentum expected with key support levels in focus
The technical analysis also hints at a possible recovery in Solana. SOL, which has been on a sideways trend for the past few months, stands above a critical support level at around $161, which aligns with the higher boundary of the recent range that was formed from mid-August to mid-October. While Solana broke out from the resistance line, prices fell back and hover around this key level since the beginning of November.
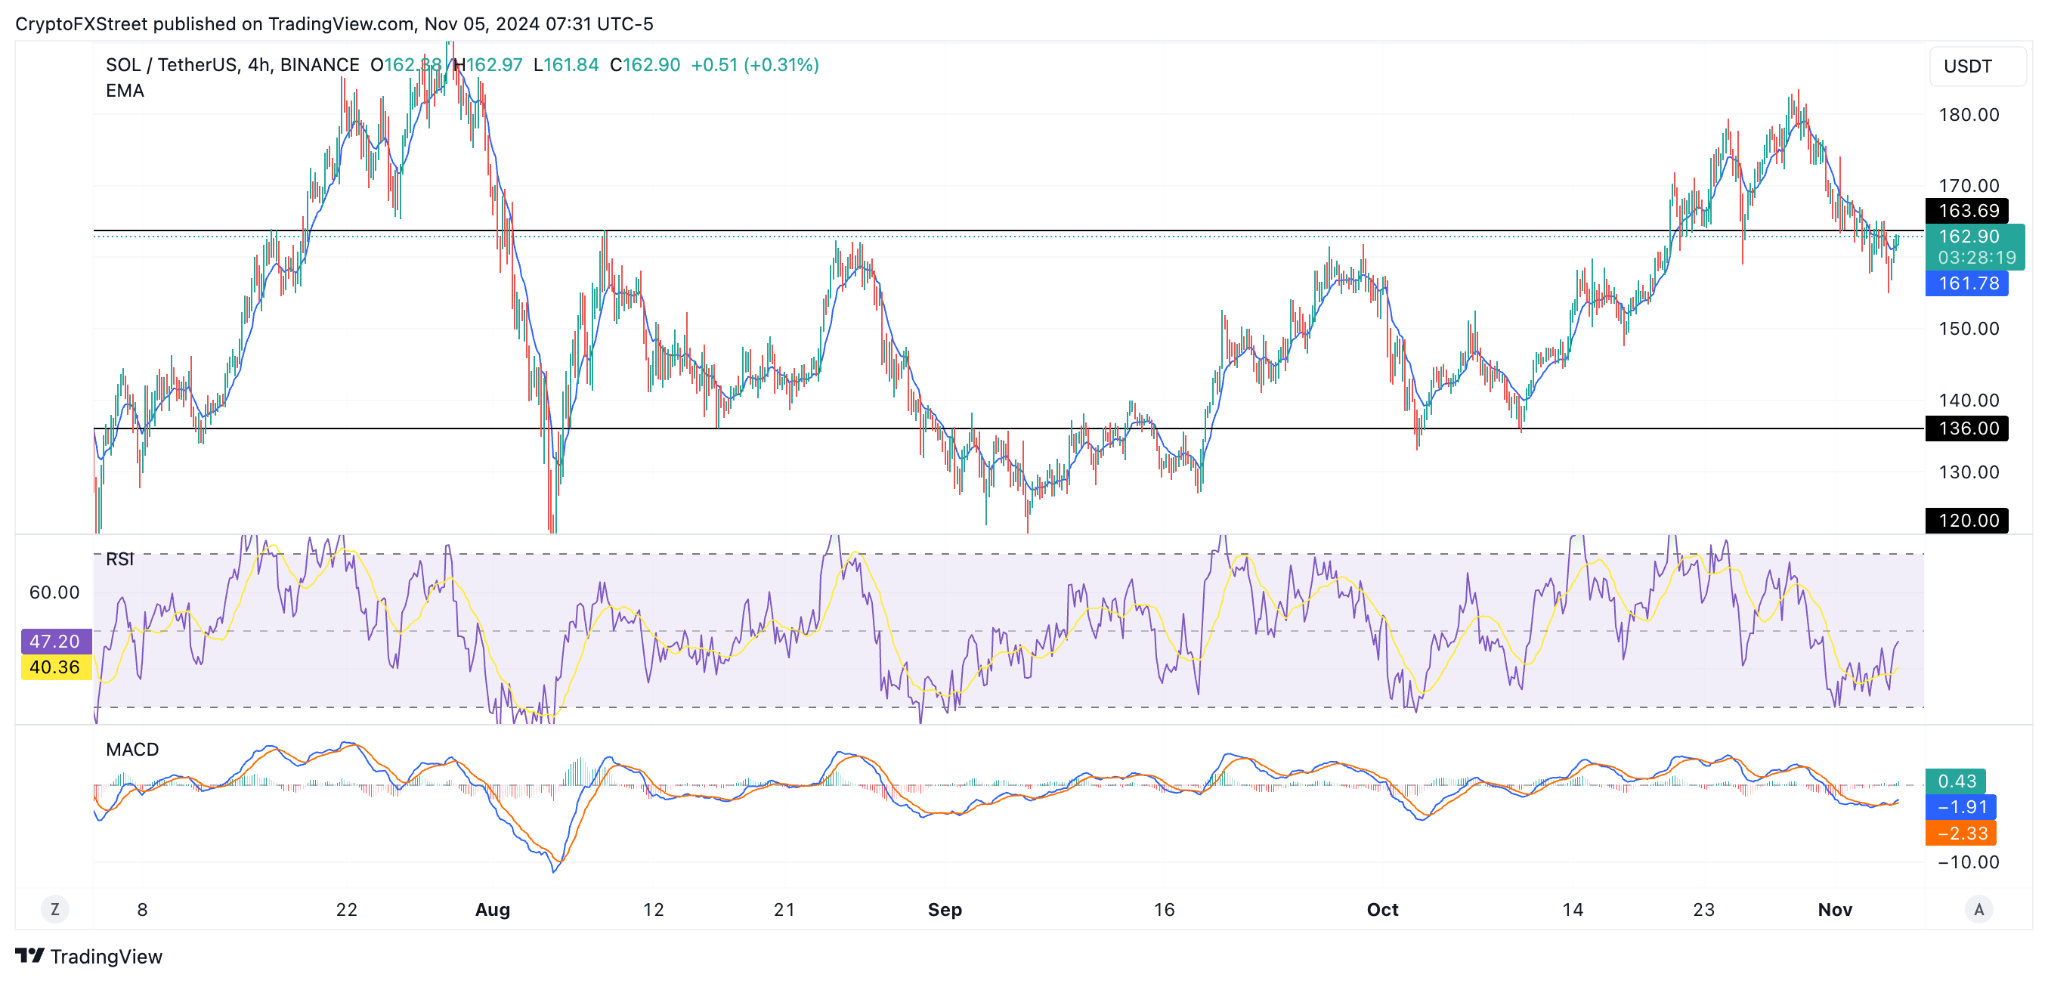
SOL/USD 4-hour chart
A daily close above $167 would likely confirm the bullish bias. From there, its next targets could be around $184 (October 29 high) and $194 (July 29 high).
The upside potential for SOL remains as long as SOL continues to trade above the 200 Exponential Moving Average (EMA) at $161.01.
Furthermore, Solana’s Relative Strength Index (RSI) in the 4-hour chart edges up to 48.22, close to the neutral level of 50, suggesting that bearish momentum is fading.
Author

Reza Ali
FXStreet
Reza Ali is a seasoned crypto-journalist and analyst with over four years of dedicated experience in the crypto and fintech space. He holds a bachelor’s degree in business administration.


