Curve DAO Price Forecast: CRV bulls could aim for double-digit gains above key resistance
- Curve DAO price trades in green on Thursday after rallying nearly 15% so far this week.
- The technical outlook suggests a double-digit gain if CRV breaks above its key resistance at $0.55.
- On-chain metrics support the bullish picture as CRV’s bullish bets are rising, and funding rates are positive.

Curve DAO (CRV) price is in the green, up 8%, trading above $0.53 on Thursday after rallying nearly 15% so far this week. The technical outlook suggests a double-digit gain if CRV breaks above its key resistance at $0.55. On-chain metrics support the bullish picture as CRV’s bullish bets are rising, and funding rates are positive.
Curve DAO could rally 23% if it breaks above its descending trendline
Curve DAO price faced rejection around its 200-day Exponential Moving Average (EMA) at $0.55 on Wednesday and declined 8.92%. This 200-day EMA level coincides with the descending trendline (drawn by connecting multiple highs with a trendline since early December), making it a key resistance zone; a breakout favours the bulls. At the time of writing on Thursday, CRV is recovering and approaching its descending trendline.
If CRV breaks above its descending trendline and closes above the $0.55 EMA level, it could extend the rally by 23% to retest its daily resistance at $0.69. A successful close above it could extend an additional gain of 20% to retest its January 31 high of $0.83.
The daily chart’s Relative Strength Index (RSI) supports the bullish outlook. It reads 55, pointing upward after bouncing off its neutral level of 50, indicating upward momentum.
The Moving Average Convergence Divergence (MACD) indicator also showed a bullish crossover last week, giving buy signals and suggesting a continuation of an upward trend.
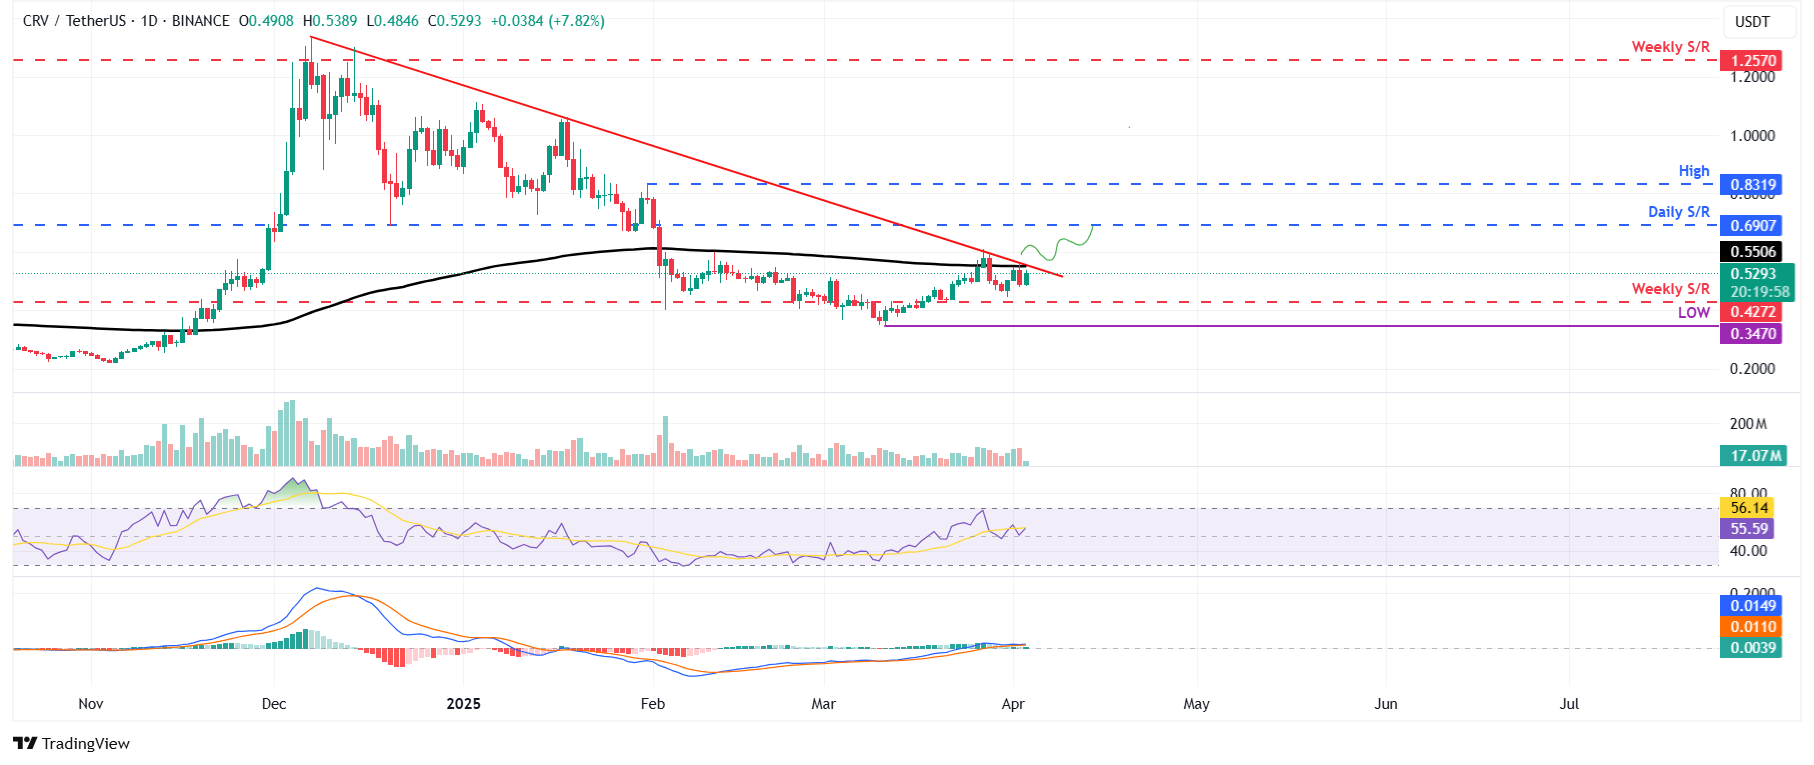
CRV/USDT daily chart
CRV bullish on-chain metrics
Diving into CRV’s on-chain metrics also aligns with the bullish outlook noted from a technical perspective. Coinglass’s long-to-short ratio data for CRV reads 1.05. This ratio above one reflects bullish sentiment in the markets as more traders are betting for the asset price to rise.
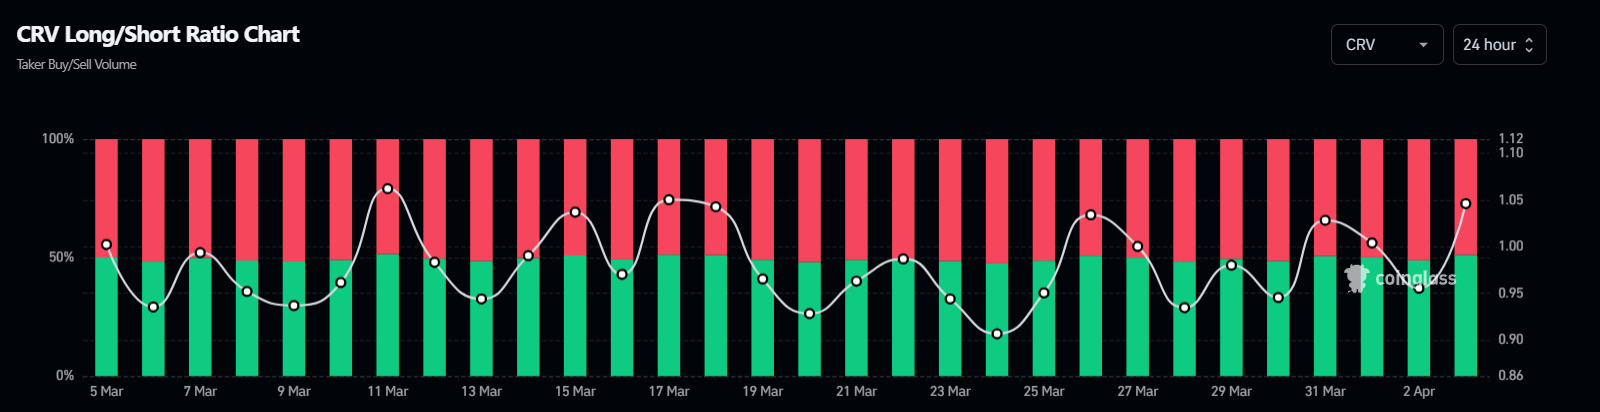
CRV long-to-short ratio chart. Source: Coinglass
Additionally, according to Coinglass’s OI-Weighted Funding Rate data, the number of traders betting that the price of CRV will slide further is lower than those anticipating a price increase.
This index is based on the yields of futures contracts, which are weighted by their Open Interest (OI) rates. Generally, a positive rate (longs pay shorts) indicates bullish sentiment, while negative numbers (shorts pay longs) indicate bearishness.
In CRV’s case, this metric stands at 0.0079%, reflecting a positive rate and indicating that longs are paying shorts. This scenario often signifies a bullish sentiment in the market, suggesting potential upward pressure on CRV’s price.
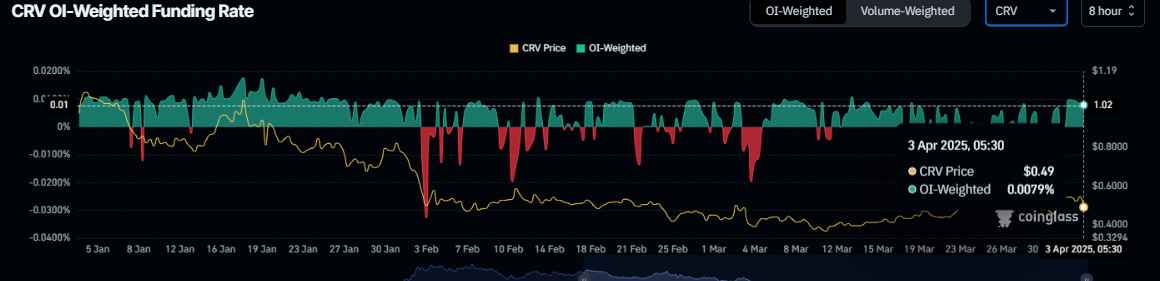
CRV OI-Weighted Funding Rate chart. Source: Coinglass
On Tuesday, CRV announced a partnership with Resupply (a decentralized stablecoin protocol that leverages the liquidity and stability of lending markets) to unlock ‘capital efficiency’ for crvUSD, Curve’s native stablecoin pegged to the US dollar. The capital efficiency makes crvUSD work harder, allowing users to do more with it, like using it as collateral, lending it out, or earning higher yields with less locked-up value. This process makes crvUSD more efficient and useful, which could draw more users to Curve Finance and, by extension, increase demand for CRV.
Curve x Resupply: Unlocking capital efficiency for crvUSDhttps://t.co/nidEBsXL2J pic.twitter.com/OlAM72gBAU
— Curve Finance (@CurveFinance) April 1, 2025
Author

Manish Chhetri
FXStreet
Manish Chhetri is a crypto specialist with over four years of experience in the cryptocurrency industry.


