Solana price eyes rally as US SEC says SOL is not a security
- The SEC withdrew its request that the court classify crypto tokens like Solana and Cardano as securities in its lawsuit against Binance.
- On-chain data shows that SOL's daily active addresses are rising, signaling greater blockchain usage.
- A daily candlestick close below $133.92 would invalidate the bullish thesis.

Solana (SOL) price faces a pullback by the weekly resistance and as of Wednesday, trades slightly higher by 0.88% at $181.13. On-chain data shows that SOL's daily active addresses are rising, signaling greater blockchain usage.
The US Securities and Exchange Commission's decision to withdraw its request for classifying crypto tokens like Solana and Cardano as securities in its lawsuit against Binance could pave the way for the approval of Solana Spot Exchange Traded Funds (ETFs), potentially enhancing investment opportunities and boosting SOL's price in the near future.
BREAKING: SEC SAYS $SOL IS NOT A SECURITY pic.twitter.com/jZ5I7KWElT
— Kyle Chassé (@kyle_chasse) July 30, 2024
Solana price shows potential for a rally
Solana price retested the trendline breakout level around $165.42 on July 25 and rose 7.5% over the next three days. On Monday, it faced a pullback by the weekly resistance level around $184.74 and declined 3% on Tuesday. As of Wednesday, it trades slightly up by 0.88% at $181.13.
If SOL continues to retrace, investors seeking buying opportunities will find that the $155.22 support level is a strategic entry point. This level aligns with the 50% price retracement level from the swing low of $121 on July 5 to the swing high of $193.71 on July 29, as well as trendline support and the daily support level. Therefore, $155.22 serves as a critical zone for potential price reversals.
Moreover, If SOL closes above the weekly resistance at $184.74, it could rally 11% to retest its daily high of $204.46 from April 1.
The Relative Strength Index (RSI) and Awesome Oscillator (AO) on the daily chart are comfortably above their respective mean levels of 50 and 0. These momentum indicators strongly indicate bullish dominance.
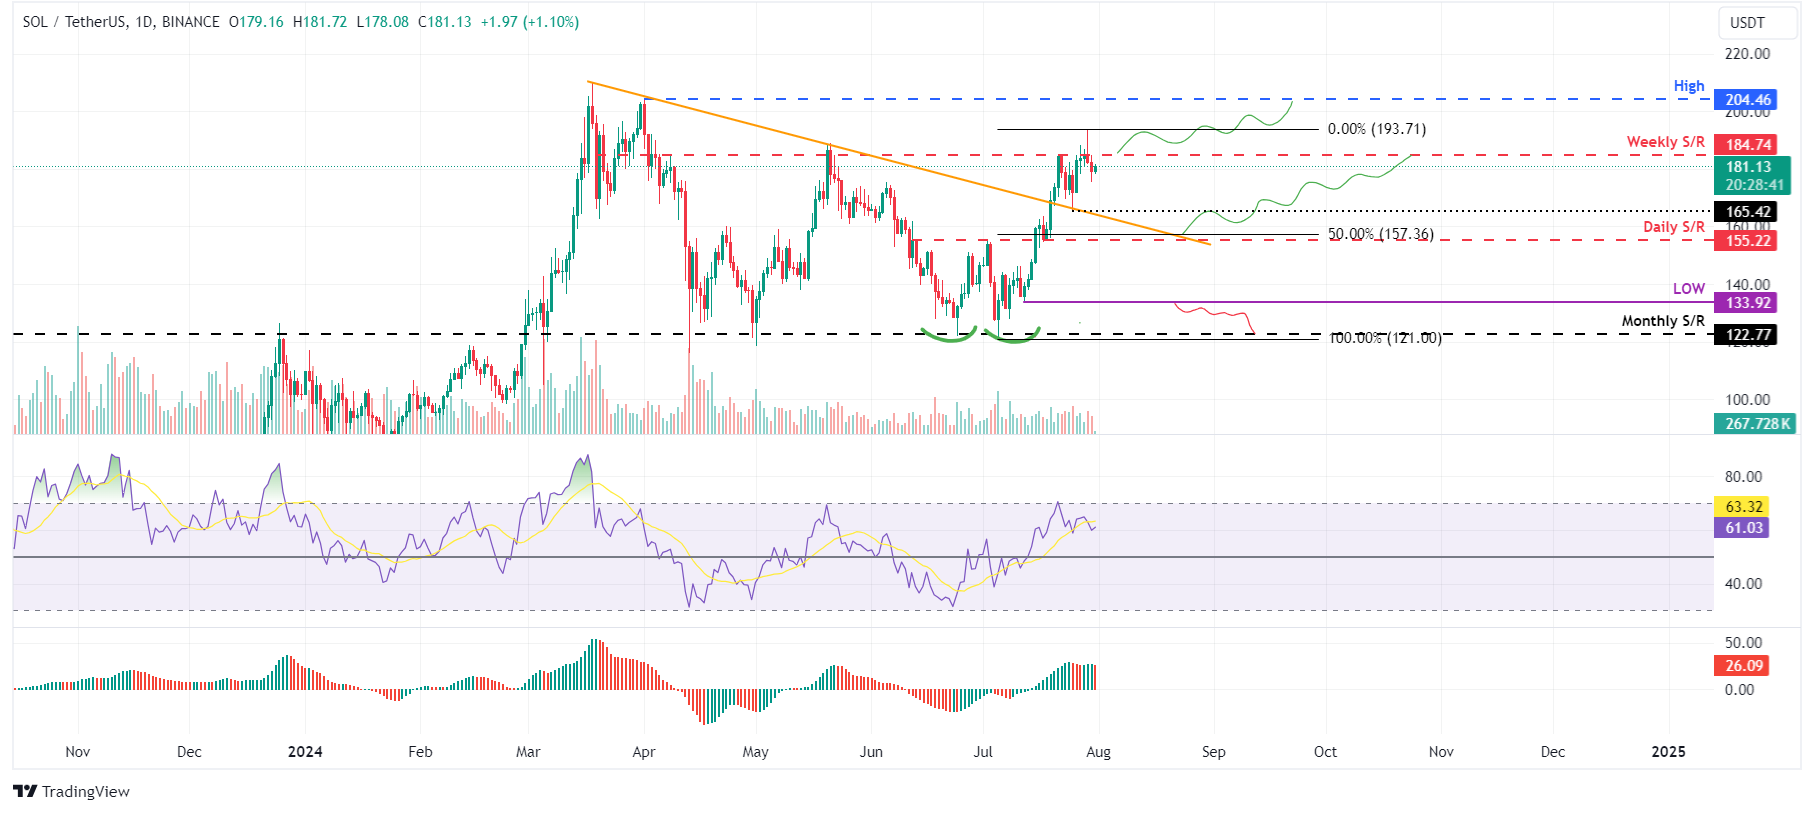
SOL/USDT daily chart
Artemis's Daily Active Addresses index, which helps track network activity over time, aligns with the bullish outlook noted from a technical perspective. A rise in the metric signals greater blockchain usage, while declining addresses point to lower demand for the network.
In Solana's case, Daily Active Addresses have risen from 1.8 million on Sunday to 2.3 million on Monday. This trend has been constantly rising since early July and indicates that demand for SOL's blockchain usage is increasing, which could propel a rally in Solana's price.
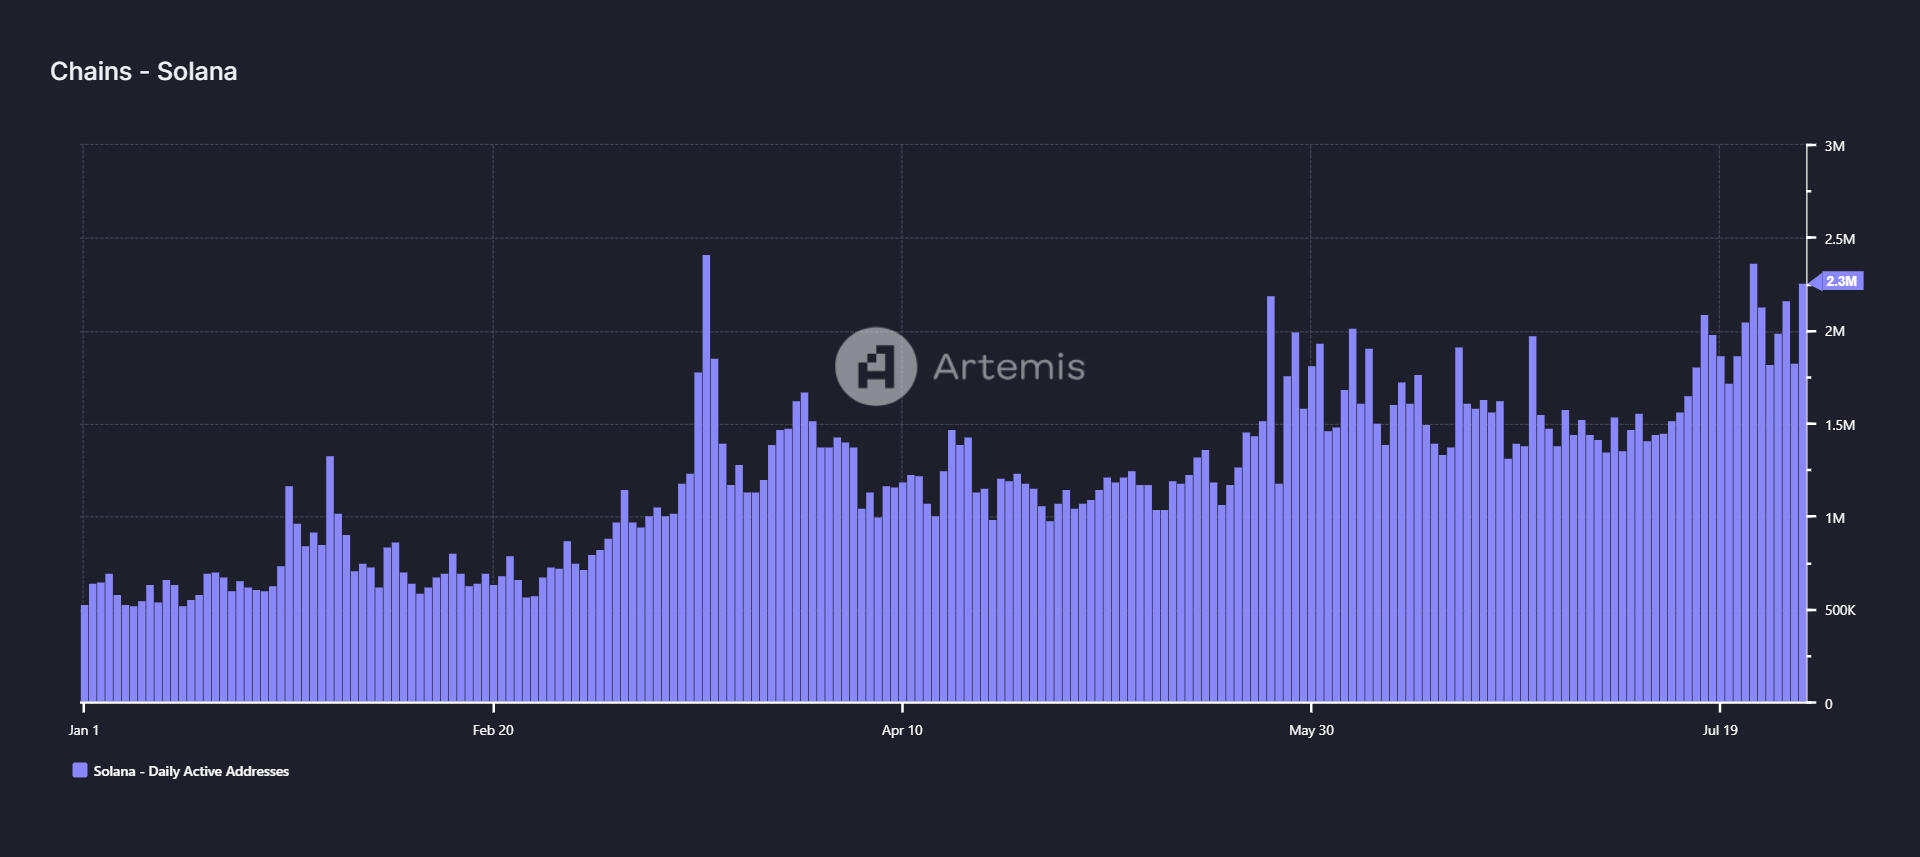
SOL Daily Active Addresses chart
Despite the bullish thesis signaled by both on-chain data and technical analysis, if the SOL's daily candlestick breaks below $133.92, the outlook would shift to bearish. This scenario could lead to a decline of 8.5% to revisit the monthly support level at $122.77.
Author

Manish Chhetri
FXStreet
Manish Chhetri is a crypto specialist with over four years of experience in the cryptocurrency industry.


