Solana price allows bulls to enter on double support before massive breakout
- Solana price breaks below the 200-day SMA but looks ready to be picked up by bulls.
- SOL’s RSI sees bullish knee-jerk reaction as bears book gains.
- As markets try to hold on to the week’s gains, expect tailwinds to lift sentiment, attracting more to the rally.

Solana (SOL) price action has been fading towards $131 after being rejected at $160, with bulls unable to make new highs. The recent break of the 200-day Simple Moving Average (SMA) looks to have been picked up by investors. A window of entry exists below the 200-day SMA, the double support at $130.70 with the low of October, and the monthly S1 support pivot, which all are seen falling in line with each other. This area creates a perfect entry point for bulls with stop losses tucked away below the $130.70 level and an upside target at at least $200 medium-term.
Solana bulls gear up for $200 medium-term price target
Solana price made a slight dead cat bounce at $130.70 last week after being rejected at $160. With the break below the green ascending trend line and the 200-day SMA, a window of opportunity is now offering itself, with the double barrier as support at $130.70. That bulls and investors are stepping on the SOL-train shows itself in the Relative Strength Index (RSI) with a bit of nudge to the upside, away from the oversold barrier.
This way, SOL investors are prepositioning for an uptrend as global markets are trying to shake off the negative sentiment from this week. Expect a return above the green ascending trend line if investors sit on their hands and do not fold preemptively. That would signal to sidelined bulls to engage as momentum is there for another uptick towards $160. Beyond that, they ought to cover ground towards $195 where SOL could break out of the downtrend entirely and add the 55-day SMA and the monthly pivot as supporting elements to their bullish arsenal.
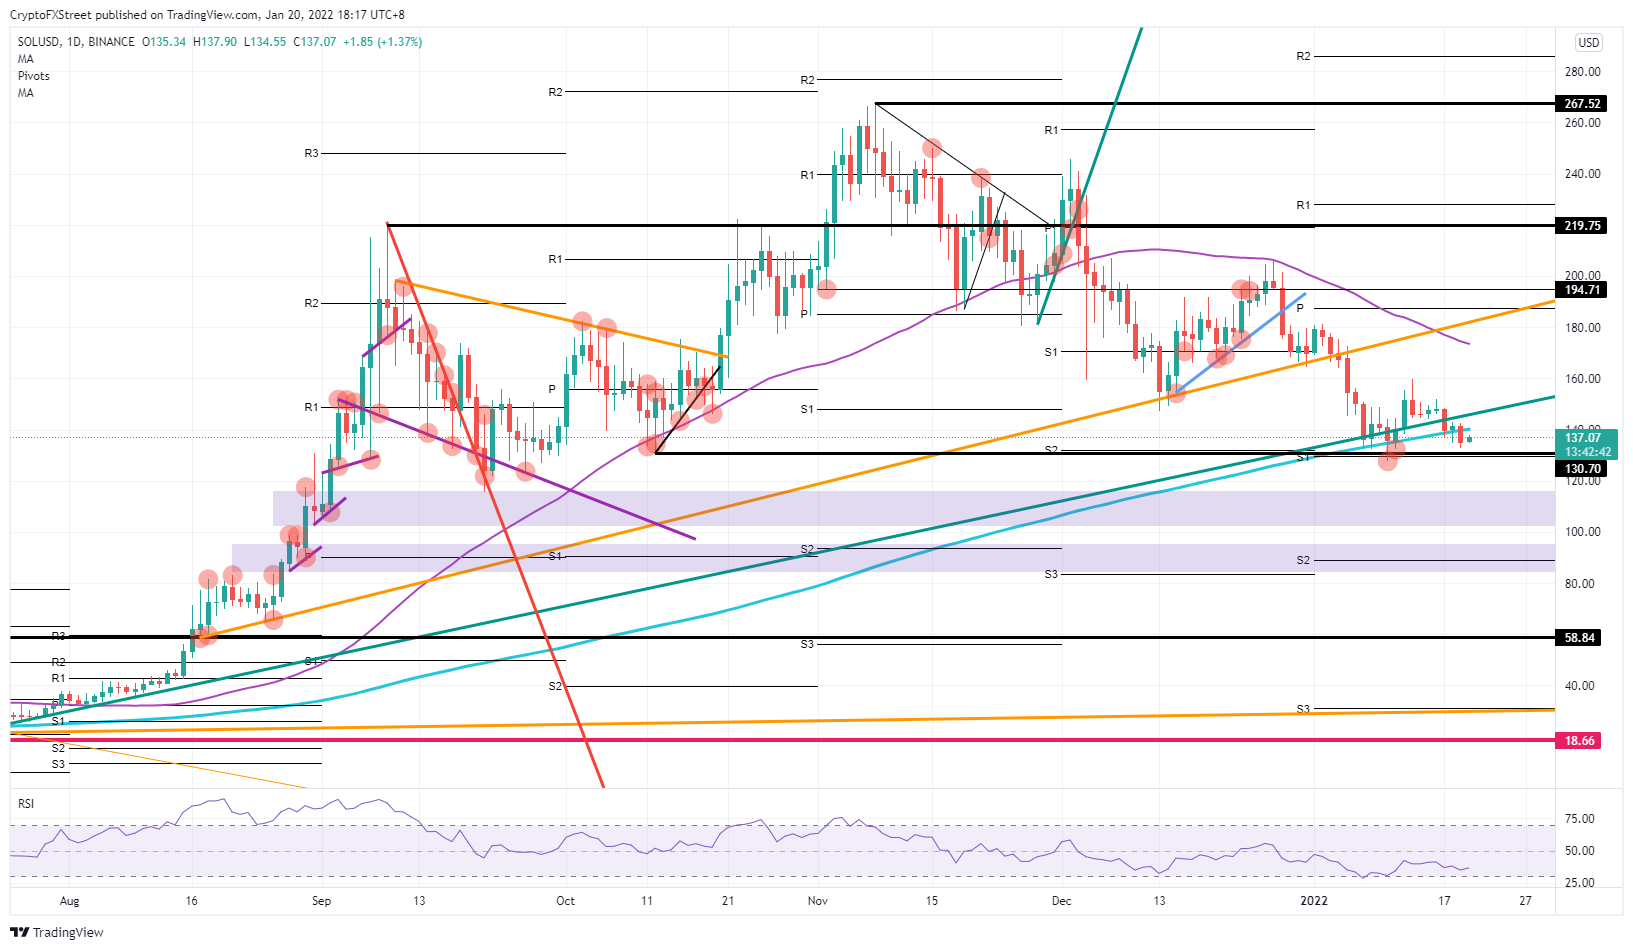
SOL/USD daily chart
The risk to the downside for SOL is from bulls waiting too long for an entry and wanting to buy too close to the $130.70 level. That could stem a break and make investors hesitant of entering, giving bears a free ticket to push price-action towards $120. With that, bulls and investors would want to wait for the next best entry, which is only at $58.84, miles away, and the S2 at $89 as a more intermediate anchor for an entry.
Author

Filip Lagaart
FXStreet
Filip Lagaart is a former sales/trader with over 15 years of financial markets expertise under its belt.



