Shiba Inu price presents buy signal, anticipates 30% breakout
- Shiba Inu price is retracing after rallying 50% in less than two days.
- This downswing will provide market participants an opportunity to accumulate SHIB before it triggers a 30% ascent.
- A breakdown of the range low at $0.0000356 will invalidate the bullish thesis.

Shiba Inu price is undergoing a minor retracement after it saw a sudden uptick in buying pressure, leading to a rally. This correction will provide sidelined buyers with an opportunity to jump on before the next leg higher.
Shiba Inu price prepares for another launch
Shiba Inu price rallied 50% between November 28 and November 30 as it rose from $0.0000362 to $0.0000543. This massive upswing is currently undergoing a retracement and hovering around the trading range’s midpoint at $0.0000452.
Investors can expect SHIB to eventually reverse after it dips back into the buy zone. This high probability reversal zone will allow investors who missed the first Shiba Inu price pump to get onboard for the next bull phase.
To enter long, market participants need to wait for a retest of the 62% Fibonacci retracement level at $0.0000431. This dip will prime Shiba Inu price to trigger a 25% surge, leading to a retest of the range high at $0.0000543.
Clearing this barrier will confirm buyers’ strength and propel Shiba Inu price to make a run at the following levels: $0.0000579 and $0.0000652. In total, the move from $0.0000431 to $0.0000652 will represent a 46% advance.
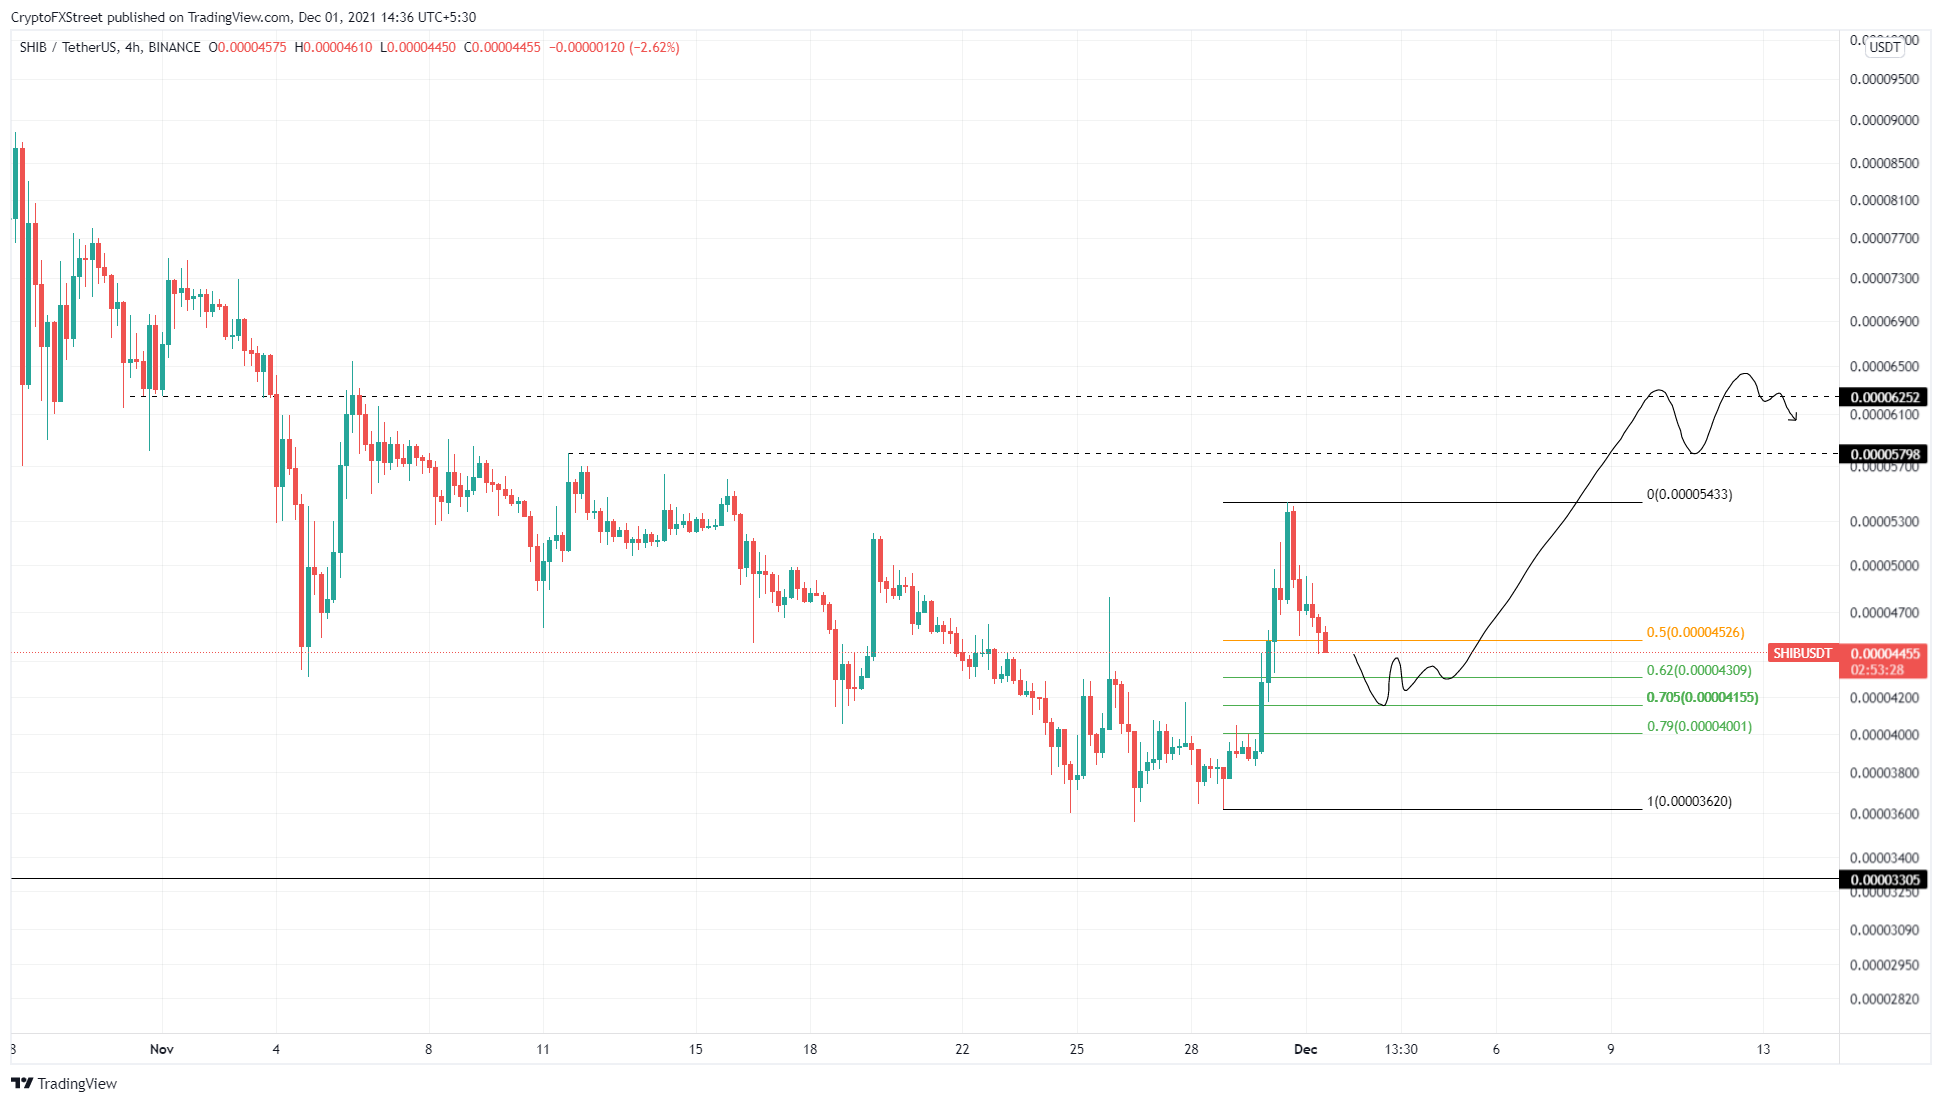
SHIB/USDT 4-hour chart
While the reversal zone, ranging from $0.0000362 to $0.0000543, has a high chance of triggering an upswing, there are chances an excessive increase in selling pressure could lead to a break below this area.
In such a situation, investors can expect Shiba Inu price to retest the range low at $0.0000362. A small dip below this area is possible and is a ploy by market makers to collect the sell-stop liquidity resting below it.
If Shiba Inu price produces a daily close below $0.0000356, it will invalidate the bullish thesis and potentially trigger a crash to $0.0000327.
Author

Akash Girimath
FXStreet
Akash Girimath is a Mechanical Engineer interested in the chaos of the financial markets. Trying to make sense of this convoluted yet fascinating space, he switched his engineering job to become a crypto reporter and analyst.



