- Shiba Inu price stumbled and is down 45% since the beginning of November.
- Several technical factors suggest the downtrend is only halfway through.
- Invalidation of the bearish outlook is a breach above $0.00001040.
Shiba Inu price shows reasons to be concerned during the third trading week of November. SHIB breaching new yearly lows could result from the current bearish technicals. Key levels have been defined to gauge SHIB's next potential move.
Shiba Inu price could rollover
Shiba Inu price has seen better days as the notorious meme coin has lost 45% of its market value since the start of November. As the world awaits Bitcoin's next move, SHIB's technicals suggest the downtrend is still ongoing. If market conditions persist, the summer lows will likely be breached in the coming days, followed by a plummet into new yearly lows.
Shiba Inu currently auctions at $0.00000911 as bears have kept SHIB confined to the lower half of the range near the bottom of the recent 45% downswing. On November 16, the bears rejected entry to the $0.00001000 level with aid from the 8-day exponential moving average. The Relative Strength Index remains in oversold territory, while the Volume Profile indicator shows a lack of interest from sidelined bulls.
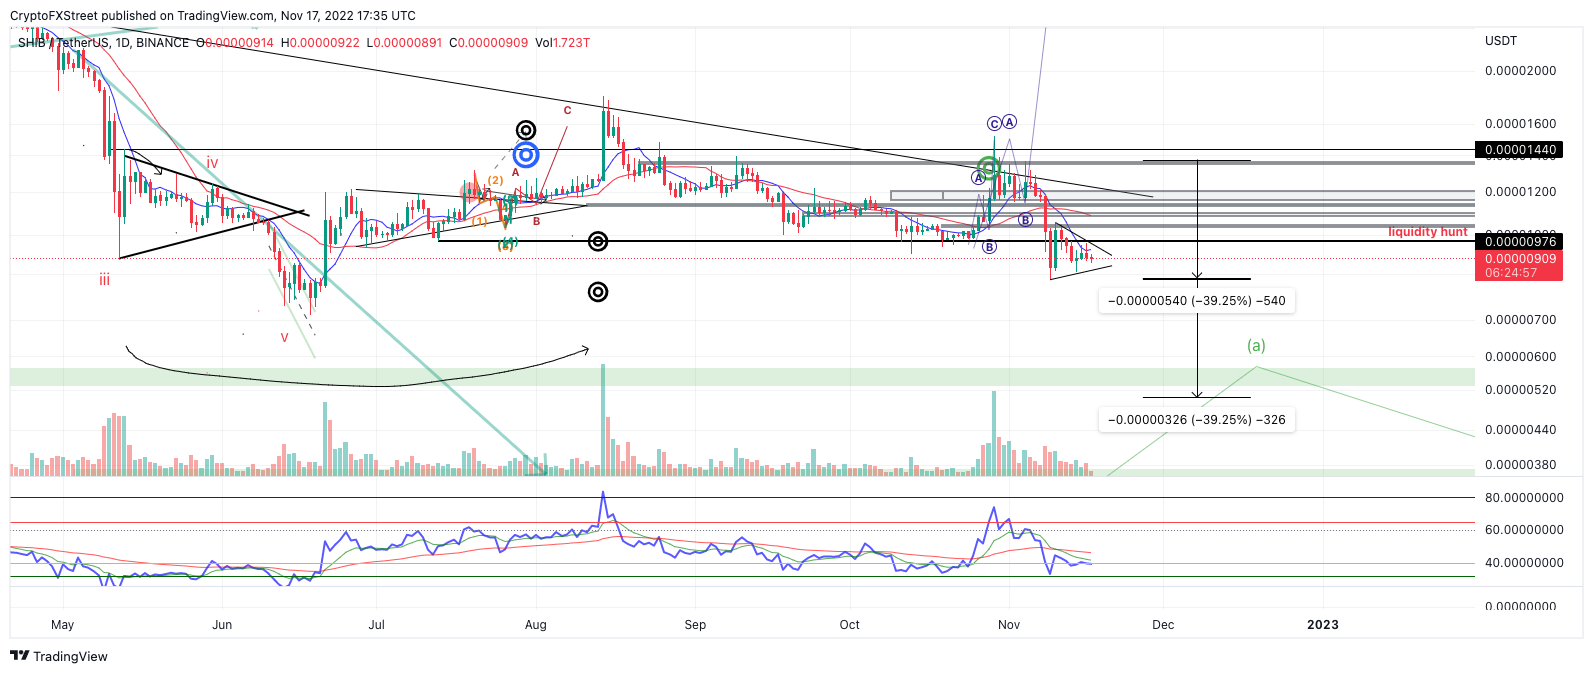
SHIBUSDT 1-Day Chart
Considering these factors, SHIB's price will likely fall in the coming days. From a classical technical analysis standpoint, there is an apparent pennant formation on the daily chart. If the pennant is genuine, a 40% decline to the downside could result from the classical pattern. Bearish targets lie at $0.00000570 and potentially $0.00000500.
Invalidation of the bearish thesis could occur if the bulls breach the $0.00001040 liquidity zone, which resides under the 21-day simple moving average. A breach of the barrier could induce a rally of $0.00001200. Shiba Inu price would rise by 33% if the invalidation scenario occurred.
In the following video, our analysts deep dive into the price action of Shiba Inu, analyzing key levels of interest in the market. -FXStreet Team
Information on these pages contains forward-looking statements that involve risks and uncertainties. Markets and instruments profiled on this page are for informational purposes only and should not in any way come across as a recommendation to buy or sell in these assets. You should do your own thorough research before making any investment decisions. FXStreet does not in any way guarantee that this information is free from mistakes, errors, or material misstatements. It also does not guarantee that this information is of a timely nature. Investing in Open Markets involves a great deal of risk, including the loss of all or a portion of your investment, as well as emotional distress. All risks, losses and costs associated with investing, including total loss of principal, are your responsibility. The views and opinions expressed in this article are those of the authors and do not necessarily reflect the official policy or position of FXStreet nor its advertisers. The author will not be held responsible for information that is found at the end of links posted on this page.
If not otherwise explicitly mentioned in the body of the article, at the time of writing, the author has no position in any stock mentioned in this article and no business relationship with any company mentioned. The author has not received compensation for writing this article, other than from FXStreet.
FXStreet and the author do not provide personalized recommendations. The author makes no representations as to the accuracy, completeness, or suitability of this information. FXStreet and the author will not be liable for any errors, omissions or any losses, injuries or damages arising from this information and its display or use. Errors and omissions excepted.
The author and FXStreet are not registered investment advisors and nothing in this article is intended to be investment advice.
Recommended Content
Editors’ Picks
Ripple's move above this key level could trigger nearly 50% rally for XRP
Ripple has overcome a critical resistance level and flipped into a support floor on the weekly time frame. This development happened while XRP tightly consolidated for roughly 250 days. Investors can expect XRP to kickstart a massive rally.
Optimism price outlook with nearly $90 million worth of OP tokens flooding markets on Friday
Optimism volatility has shrunk in the ours leading to the network’s cliff unlock. It joins the likes of dYdX and Sui, which have similar events on their calendars. As token unlocks are often considered bearish catalysts, investors should brace for a reaction after the event.
Top 3 Price Prediction Bitcoin, Ethereum, Ripple: Retail watches from the sidelines with a bias for shorts
Bitcoin could clear $73,777 peak as BTC bulls resurface. Ethereum might fall 10% before next leg up as ETH RSI teases with sell signal. XRP could lose $0.6000 threshold as Ripple bulls fail to show up.
Jito price could hit $6 as JTO coils up inside this bullish pattern
Jito price action shows a potential cup and handle formation. Based on theoretical measurement rules, a successful breakout could yield a 56% rally to $6.0. A breakdown of the $3.86 support level would create a lower low for JTO and invalidate the bullish thesis.
Bitcoin: BTC may have recovered, but is it out of the woods?
Bitcoin’s (BTC) upward momentum has shown a significant decline for the past two weeks or so. This development led to a bearish signal on the weekly and an uncertain outlook on the monthly.