Shiba Inu Price Prediction: SHIB is dead money below $0.00000733
- Shiba Inu price is not gaining inspiration from a more robust cryptocurrency complex over the last eight days.
- Upward resolution of the minor descending parallel channel on July 21 does not gain price traction.
- SHIB is down 2.5% this week while Bitcoin is up almost 12%, Ethereum 5% and Dogecoin 4%.

Shiba Inu price was presented with an opportunity on July 21 as it released from a minor parallel channel and the cryptocurrency complex initiated a new rebound that has taken on an impulsive personality. Instead, SHIB has drifted sideways and currently trades below the July 21 close of $0.00000654. The inability of SHIB to generate any price strength indicates a reluctance to traffic in the higher-risk cryptocurrencies in an environment in which fear of missing out (FOMO) has not yet reappeared.
Shiba Inu price boredom disguises internal warfare between investors
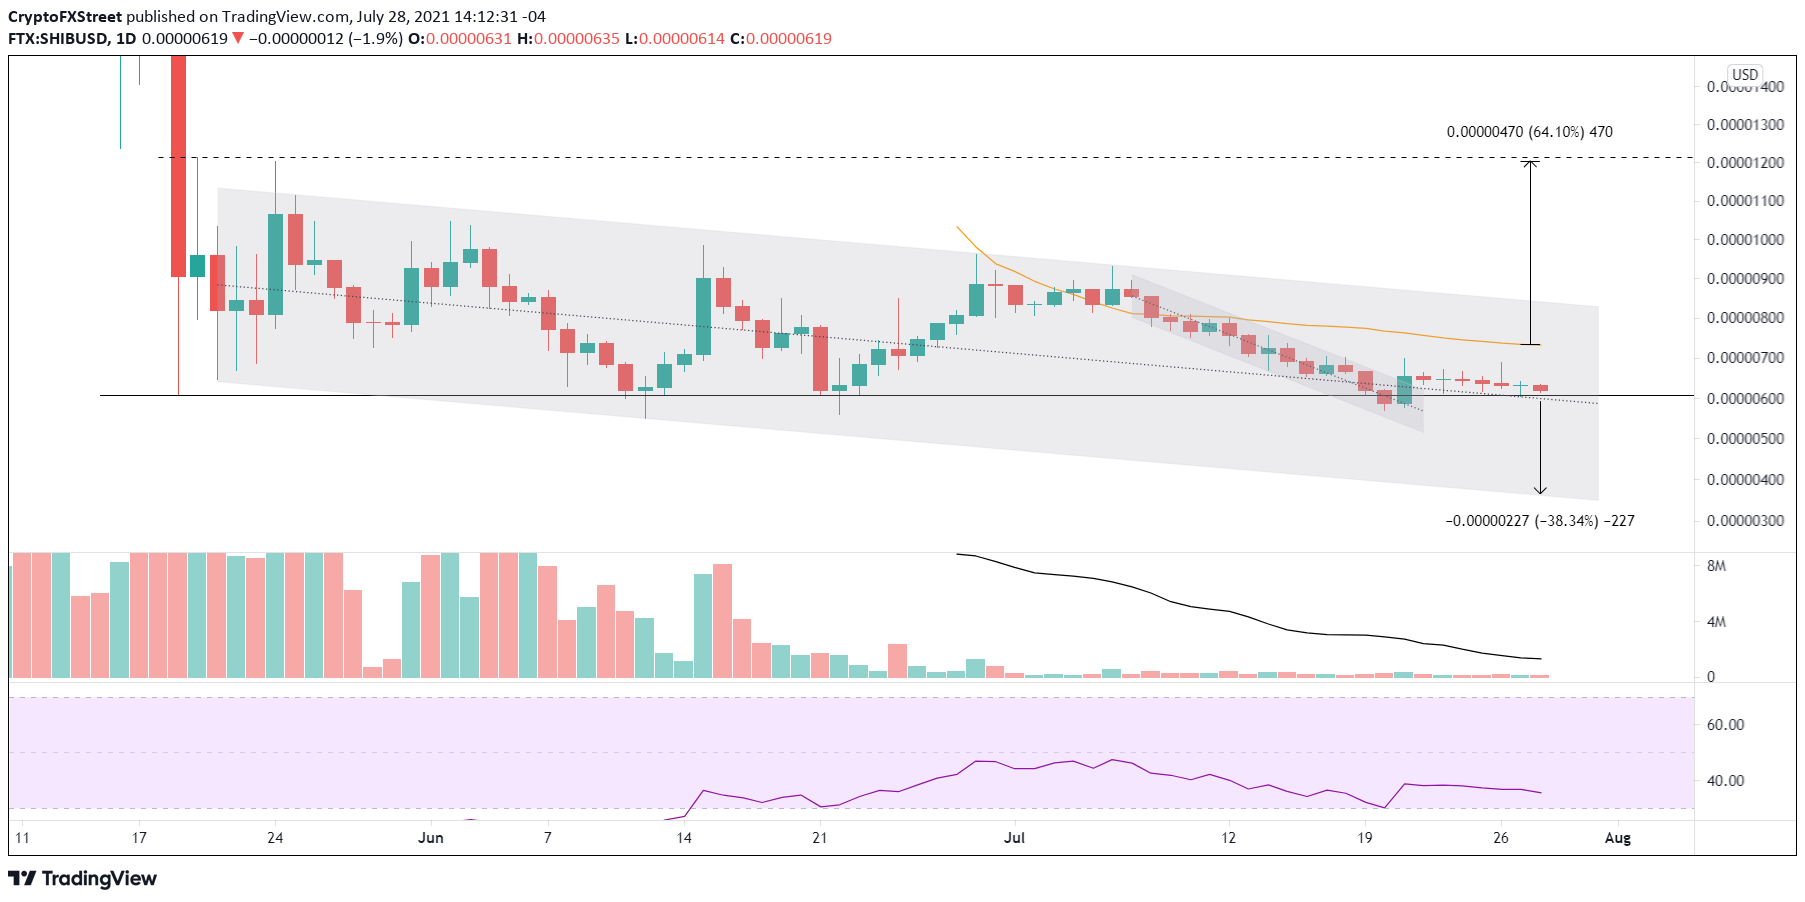
Shiba Inu price is drifting along the union of the May 19 low of $0.00000607 and the larger descending triangle’s midline around $0.00000600, suggesting that SHIB does have a precise and important line of defense. The problem is that the support is not commanding any bid from market speculators, despite the renewal of strength in the cryptocurrency market.
Moving forward, an inflection point for Shiba Inu price is the 50-day simple moving average (SMA) that has pressed down on price since appearing on the charts in late June. A daily close above the moving average would clear SHIB for a run to the resistance line of the larger descending parallel channel around $0.00000840, providing a gain of 14.5% from the moving average.
A daily close above the larger channel’s resistance line introduces the opportunity for SHIB to test several layers of resistance accumulated over the last two months. The first level is the July 6 high of $0.00000932, followed by the June 15 high of $0.00000986, the June 2 high of $0.00001048 and finally, the May 24 high of $0.00001204. A rally to the May 24 high would claim a 64% gain from the 50-day SMA.
SHIB/USD daily chart
On the downside, a daily close below the May 19 low and the larger channel’s midline would immediately press Shiba Inu price down to the July 20 low of $0.00000588 and raise the odds that SHIB will visit the channel’s support line around $0.00000362.
As long as Shiba Inu price transacts below the 50-day SMA at $0.00000733, there is no need to traffic in the altcoin. SHIB needs to demonstrate the beginnings of a new uptrend through the successful close above considerable resistance. Anything less risks unnecessary losses.
Here, FXStreet's analysts evaluate where SHIB could be heading next as it remains consolidating.
Author

Sheldon McIntyre, CMT
Independent Analyst
Sheldon has 24 years of investment experience holding various positions in companies based in the United States and Chile. His core competencies include BRIC and G-10 equity markets, swing and position trading and technical analysis.