Shiba Inu Price Prediction: Mapping out the aftermath of SHIB’s rigorous token burn campaign
- Shiba Inu price ignores a descending triangle pattern’s breakout, forming two consecutive bullish candles.
- Shytoshi Kusama, a pseudonymous developer, proposes new ways of burning SHIB.
- Shiba Inu price must reclaim the triangle’s x-axis support to avert a possible 46.10% crash.
Shiba Inu is one of the tokens flipping green on Monday after a gruesome weekend session that saw the meme token extend its down leg slightly below $0.00001000. The launch of Shiba Eternity card game launched in Australia failed to positively impact the price, paving the way for a descending triangle pattern breakout. Sustainable recovery is anticipated if SHIB reclaims support at $0.00001179.
ShibaEternity to contribute to Shiba Inu burning spree
The iOS version of the much-anticipated Shiba Eternity card game went live in Australia over the weekend. Developers are working on an Android game version – expected in a few days.
Meanwhile, Shytoshi Kusama, a pseudonymous developer, has proposed new ways to beef up the Shiba Inu token burning campaign. Reports from the developer point to Shiba Eternity as the new burn avenue as soon as the blockchain version of the game launches.
“SHIBARMY, there will be burns from the game period. Upcoming details will explain why Shiba Eternity is powerful, challenging, and great for Shiba Inu, Shiboshi holders, and Shibarium once the blockchain version is released. The real question is where will you be on download day?” Shytoshi Kusama said via Twitter on September 17.
Shiba Inu burn rate hits new peak
The Shiba Inu burn rate soared the previous week, tagging a new record high. Approximately $61,329,300 worth of SHIB was destroyed last week alone – sending the burn rate 42% higher by Monday 19.
“In the past 24 hours, there have been a total of 61,329,300 SHIB tokens burned and 9 transactions,” Shibburn announced via Twitter.
Despite the skyrocketing burn rate, Shiba Inu price slipped out of a descending triangle pattern, as observed on the 12-hour chart. Support at $0.00001050 cushioned SHIB price from stretching its down leg 46.10% below the breakout point at $0.00001178.
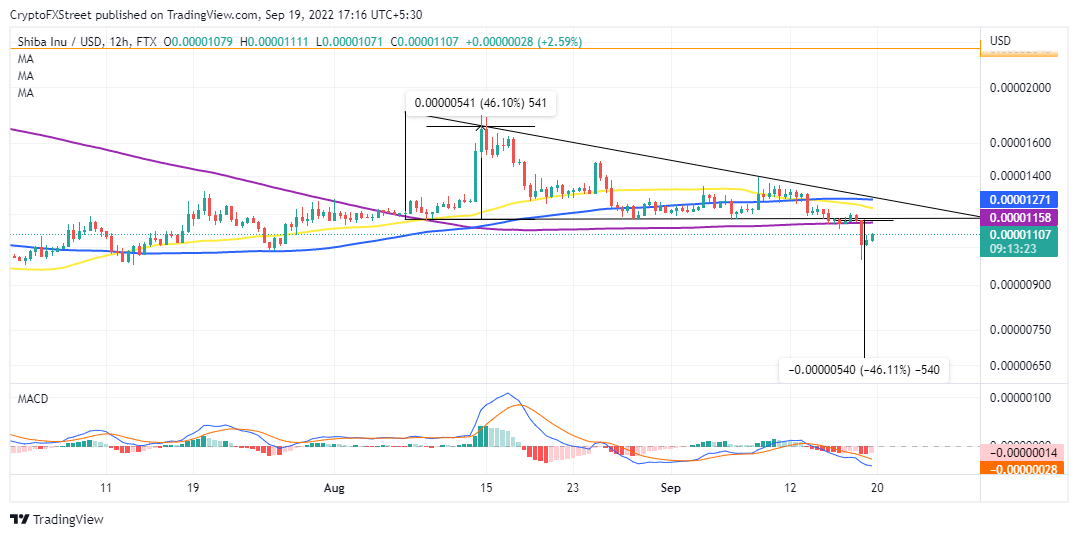
SHIB/USD daily chart
Traders started buying Shiba Inu price after its bearish candle wick tagged a low of $0.00000999 on Sunday, which explains the meme token’s bullish outlook on Monday. SHIB’s new uptrend will remain shaky until the breakout point at $0.00001178 is reclaimed. Otherwise, losses might stretch 46.11% to $0.00000632.
The same daily chart reveals a bearish signal from the Moving Average Convergence Divergence (MACD) indicator. Shiba Inu price is bound to trend south if the MACD continues negatively divulging from the price. Potential support areas lie at $0.00000999 and $0.00000850; if push comes to shove, downhill levels to $0.00000632 would be tested.
-637992001133322048.png)
Shiba Inu IOMAP chart
The IOMAP by IntoTheBlock points to a robust resistance range between $0.00001100 and $0.00001200 – likely to arrest the Shiba Inu price bullish move. Around 12,700 addresses previously bundled up 50.76 trillion SHIB tokens. A break above this zone is very unlikely because as Shiba Inu price recovers, holders within the area may sell at their respective breakeven points, cementing the resistance.
Author

John Isige
FXStreet
John Isige is a seasoned cryptocurrency journalist and markets analyst committed to delivering high-quality, actionable insights tailored to traders, investors, and crypto enthusiasts. He enjoys deep dives into emerging Web3 tren


