Shiba Inu price sets the stage for a long-term play
- Shiba Inu price shows bear trend persistence after the recent breakdown of the support confluence at $0.0000118.
- A continuation of the selling pressure could see SHIB drop 25% to $0.0000083.
- The bearish thesis will face invalidation if the meme coin flips the $0.0000118 hurdle into a support floor.

Shiba Inu price has breached a critical support confluence, indicating a shift in momentum from bulls to bears. This development comes after undoing the mid-August gains and could set the trend until SHIB finds a stable support level to bounce off of.
Shiba Inu price and its launch pad
Shiba Inu price plunged below a critical support confluence at $0.0000118 after four weeks of grappling with it. This development might look like a bearish move, but if this trend continues, it will set SHIB up for a long-term play.
For now, Shiba Inu price can drop 20% before encountering the imbalance, aka the fair value gap (FVG), extending from $0.0000092 to $0.0000083. A retest of this area will be an ideal place for buyers to step in and trigger a trend reversal.
The chart below shows that the market makers could target the liquidity resting above the equal highs at $0.0000179 for a long-term play, indicating the total potential gain for investors is roughly 95%.
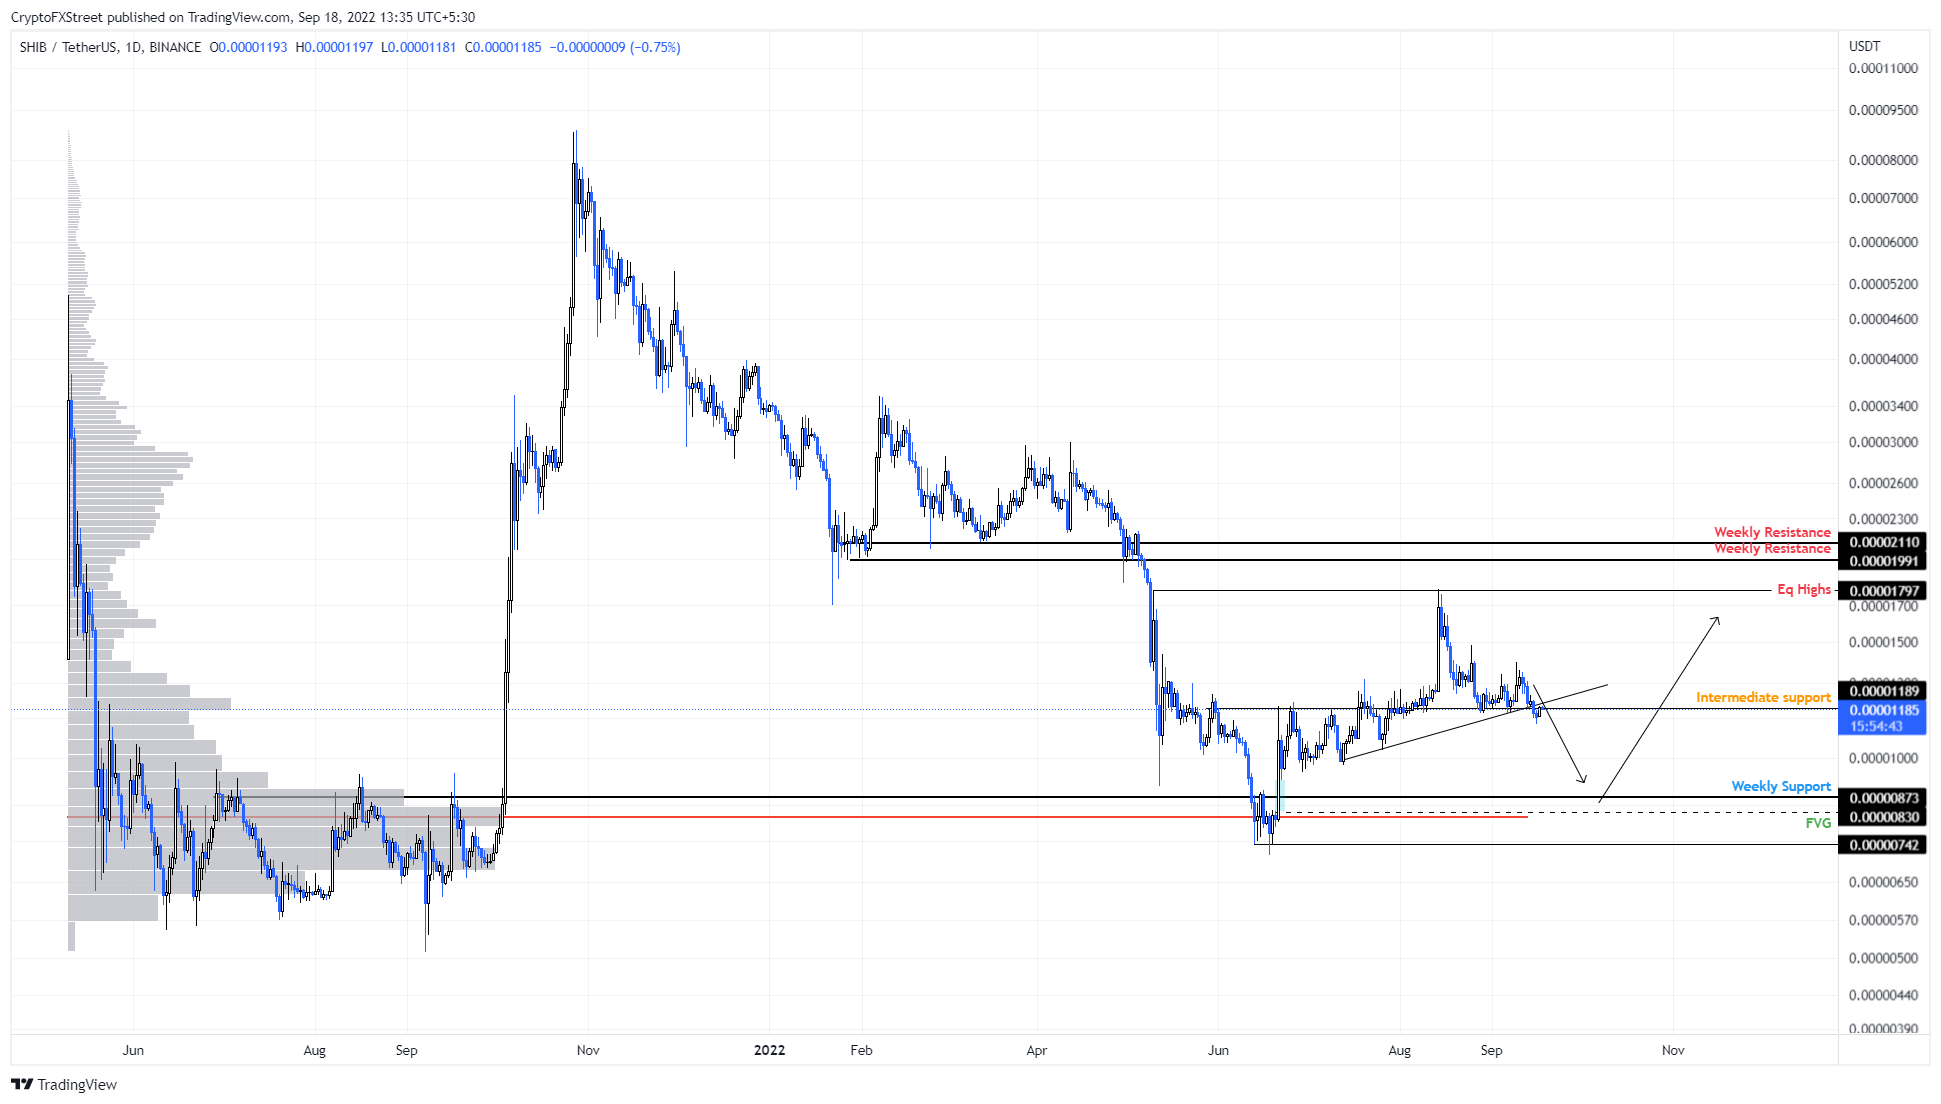
SHIB/USDT 4-hour chart
There are two ways this setup could ruin; the first one is by a premature rally in Shiba Inu price and the second one involves SHIB flipping the $0.0000087 support level into a resistance barrier.
While the former scenario does provide an opportunity to squeeze gains, the second outlook would invalidate the bullish outlook for SHIB.
Note:
This video explains the short-term and long-term outlook for Shiba Inu and how you can position yourself accordingly.
Author

Akash Girimath
FXStreet
Akash Girimath is a Mechanical Engineer interested in the chaos of the financial markets. Trying to make sense of this convoluted yet fascinating space, he switched his engineering job to become a crypto reporter and analyst.



