Shiba Inu Price Prediction: Can SHIB bulls get a win in January?
- Shiba Inu price closed out in December with a 13% loss in market value.
- SHIB remains submerged beneath November’s support zone.
- The bulls need to hurdle the $0.00000834 zone into support to consider aiming for bullish targets.

Shiba Inu price ended in 2022 on a bearish note. Now, as the new year starts, the bulls are trying to reconquer territory and return lost funds back into the hands of investors.
Shiba Inu price is underwater
Shiba Inu price has yet to display the bullish cues needed to justify adding more SHIB tokens to traders’ portfolios. December’s auction settled at a 13% loss of market value from the opening price as bulls failed to prompt the anticipated end-of-year rally.
Shiba Inu currently trades at $0.00000820. On January 2, the smaller time frames lean bearish, but the bulls are trying to alter the narrative. The 8-day exponential moving average (EMA) has been successfully flipped into support, and now the 21-day simple moving average (SMA) will soon engage with the notorious meme coin.
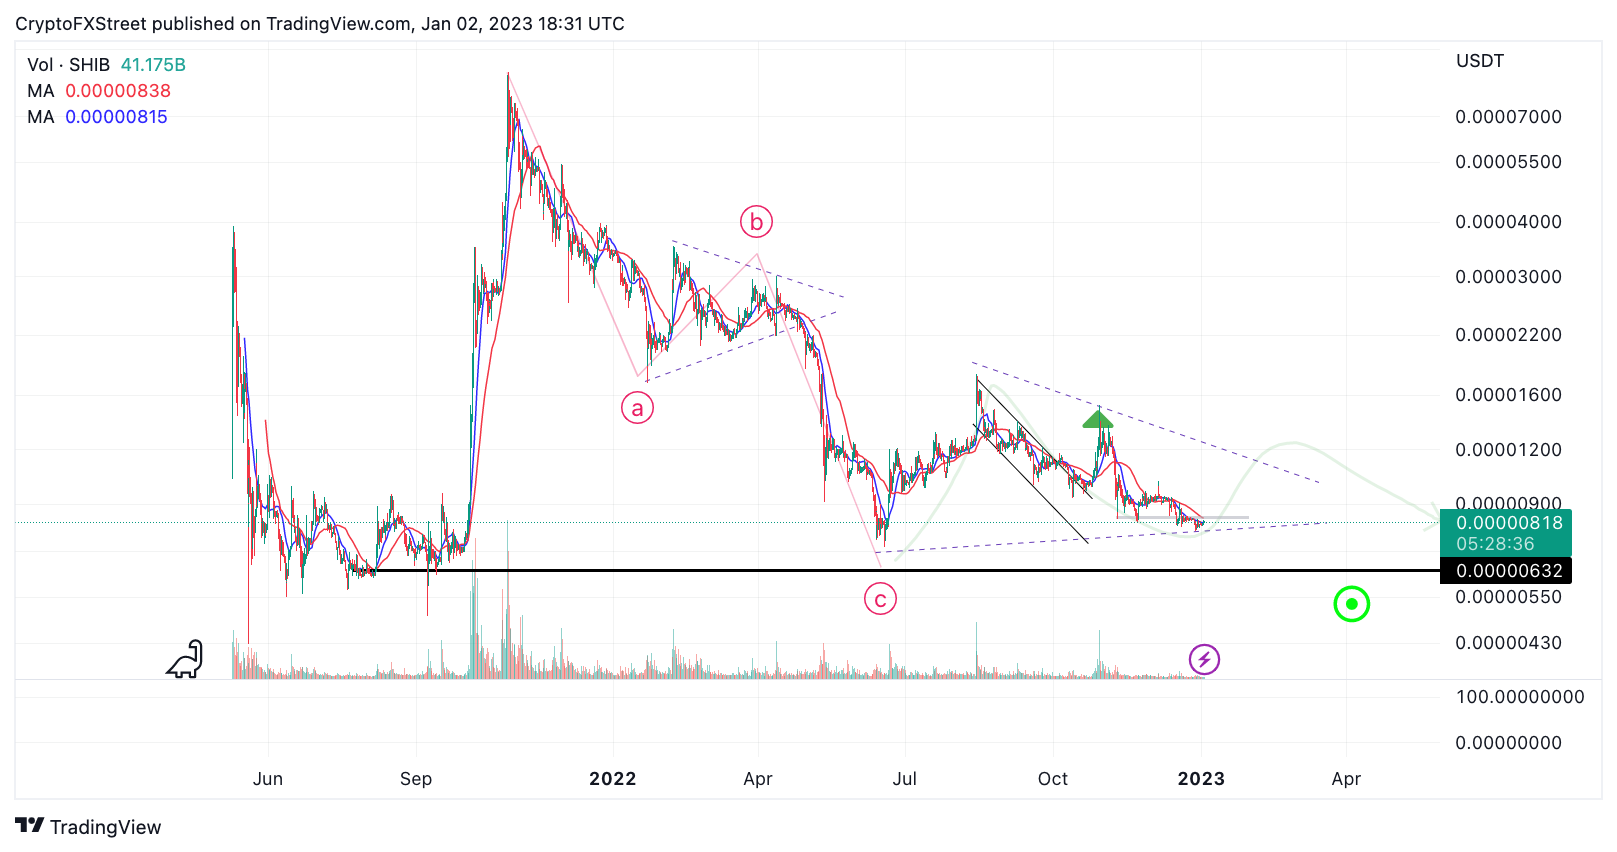
SHIB/USDT 12-Hour Chart
A bullish hurdle of the 21-day SMA (positioned at $0.00000834) could prompt a rally into the mid-way point of December’s trading range near $0.00000900. The Shiba Inu price would increase by 11% if the bulls were successful.
On the contrary, SHIB remains suppressed under November’s broken support zone. A breach of December’s low at $0.00000780 could be the catalyst for a sweep-the-lows event targeting the 2022 low at $0.00000714. The SHIB price will decline by 13% if the bearish scenario occurs.
It is worth noting that an unbreached liquidity zone from 2020 lies 30% below the current trading range at $0.00000632. Therefore, diving into the market for a knife-catch opportunity in anticipation of a double bottom near the yearly lows would be ill-advised.
Author

Tony M.
FXStreet Contributor
Tony Montpeirous began investing in cryptocurrencies in 2017. His trading style incorporates Elliot Wave, Auction Market Theory, Fibonacci and price action as the cornerstone of his technical analysis.



