Shiba Inu Price Prediction: Buy Opportunity or the Start of the End?
- Shiba Inu price witnessed the strongest decline of the year falling by 11%.
- SHIB could rally by 45% if the current level holds as support.
- The entire uptrend is subject to being reversed if the RSI falls beneath 40 as confirmation.

Shiba Inu price is experiencing an increase in volatility as the price has declined by the largest percentage amount this year. This analysis enables traders to forecast a bullish and bearish scenario through the use of technical indicators and classical price action techniques.
Shiba Inu price setting up for a trade
Shiba Inu price witnessed the strongest red day of the year as the digital meme coin has fallen by 11% on the day. At the time of writing, the price is coming into a previously established trend line, which is a determining factor for the future price action of the token. If the bulls do not provide support at the current level, then traders can expect a deeper decline to occur.
Shiba Inu is currently trading at $0.00012134. The bears are attempting to forge a candlestick close beneath the 21-day simple moving average on the daily time frame. If successful, this would be the first sign that the overall uptrend that began during the last week of December has come to an end.
Still, there is always a chance that the uptrend could continue. The Relative Strength Index (RSI) shows the current price coming back into levels of support with bullish divergences from the prior consolidation zone near $0.00001050. Thus, the dip being witnessed could be viewed as a buying opportunity in the grand scheme of things. A fall beneath the 40 level on the RSI would indicate that the entire uptrend is subject to liquidation.
The next key level of interest for bulls to aim for is the August high at $0.00001800, which would result in a 45% increase in price from SHIB's current market value.
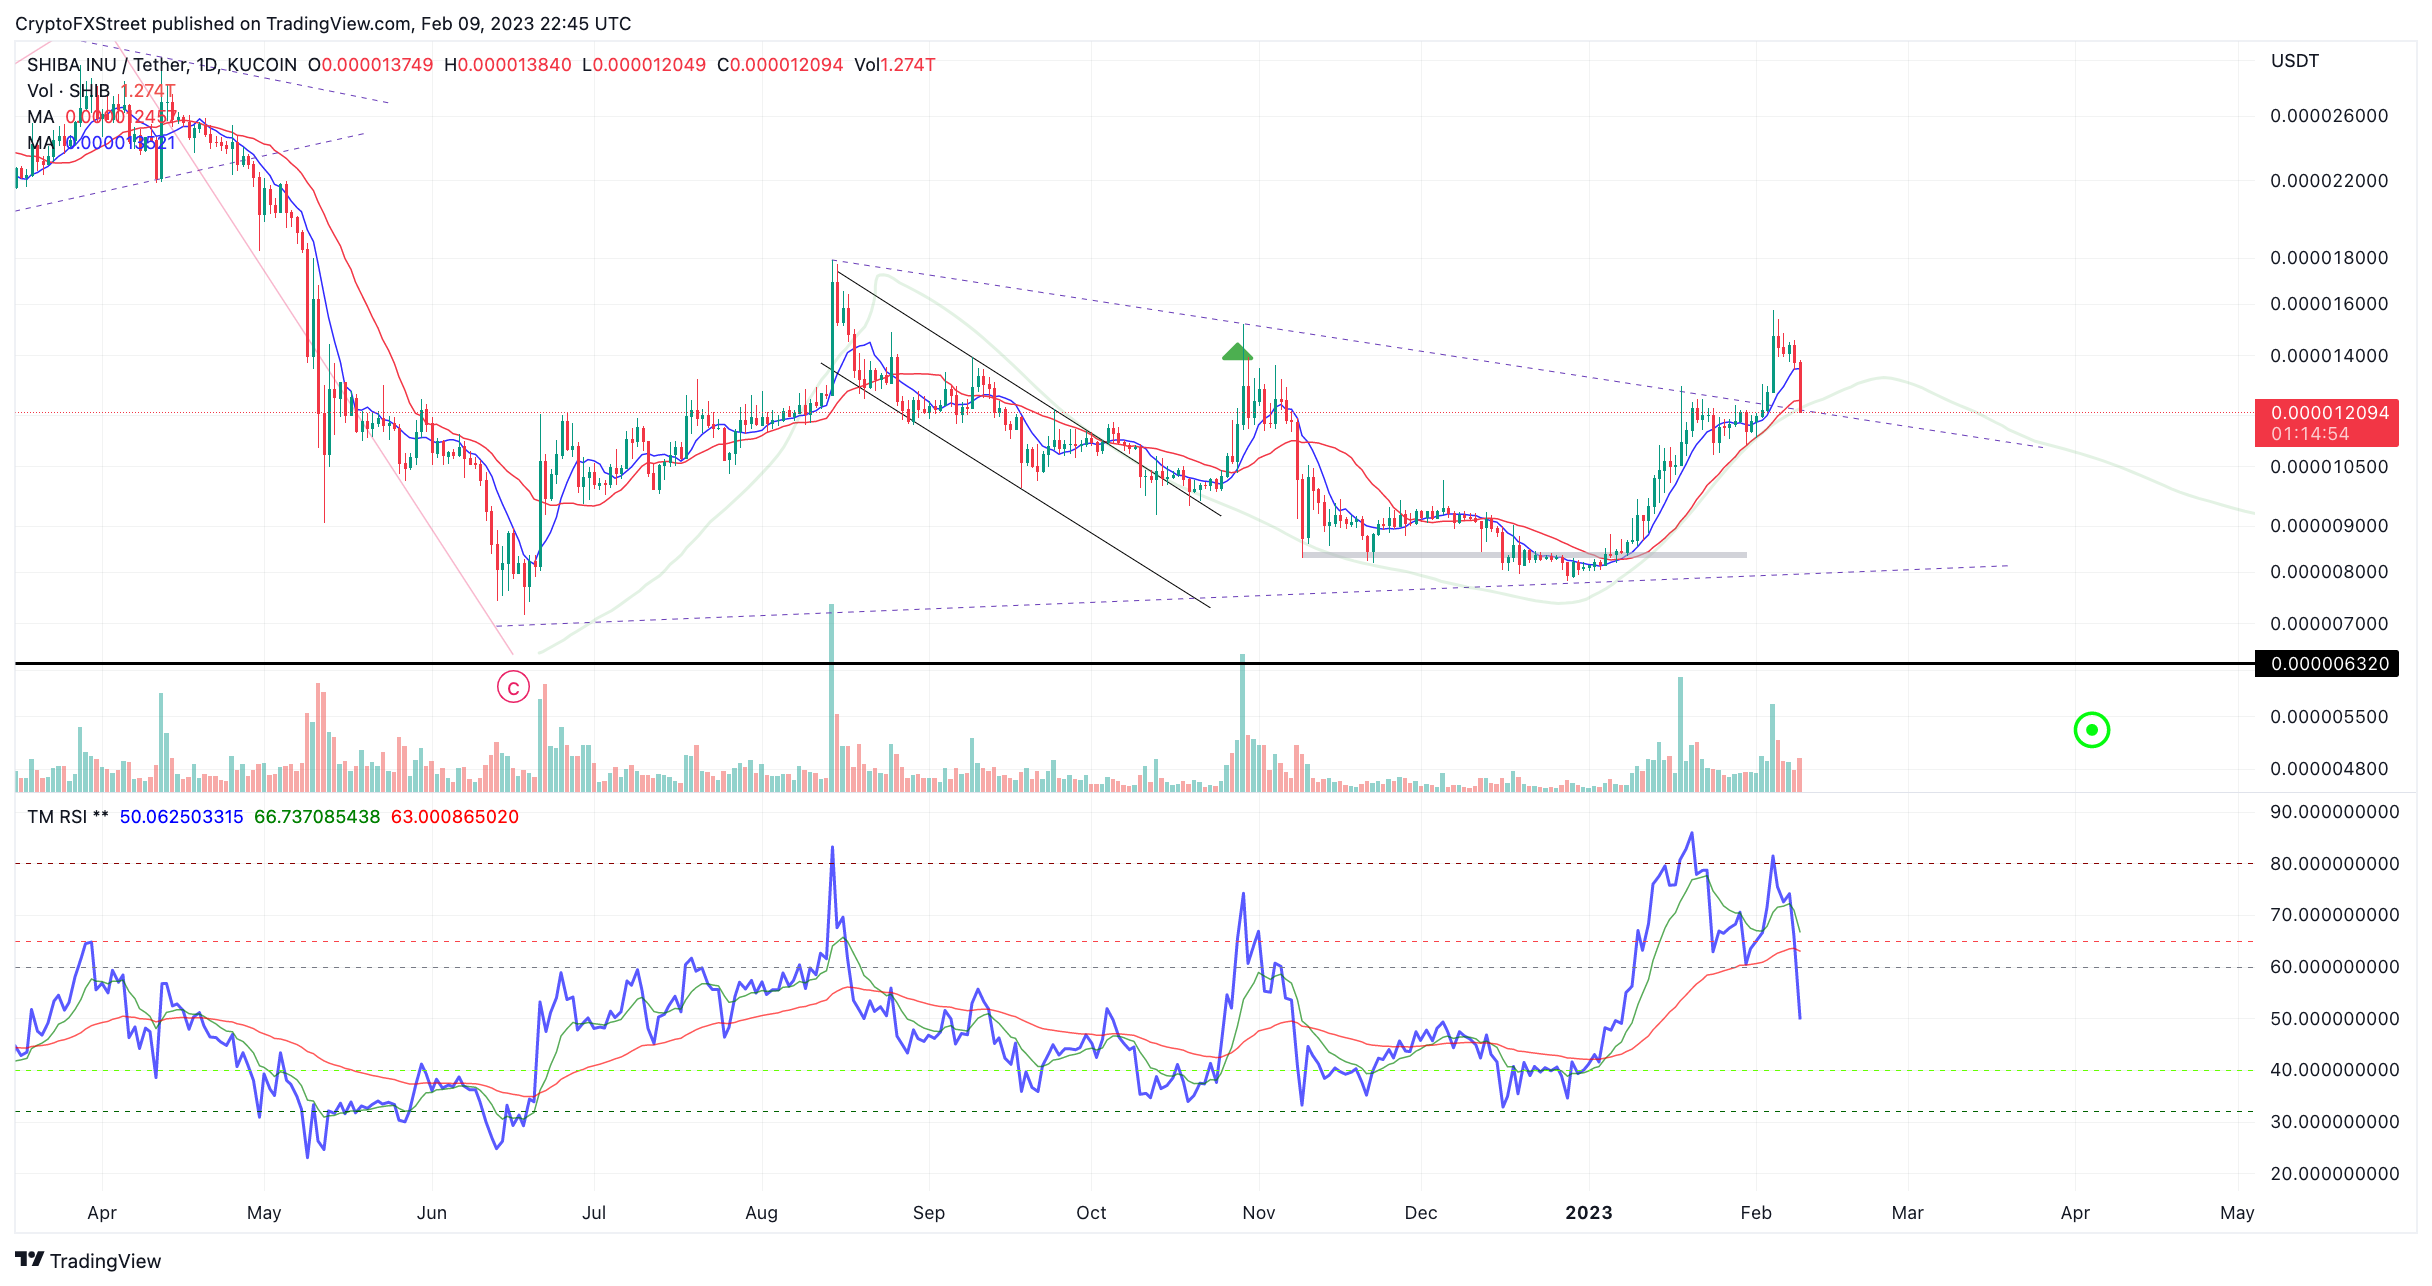
SHIB/USDT 1-Day Chart
On the contrary, if the RSI does break beneath 40, the bears who entered the market near the current swing high at $0.00001575 would likely start adding to their positions. A selling frenzy could manifest as a result, targeting the origin point of SHIB's winter rally near $0.00000780. The bearish scenario creates potential for a 36% decline from the current Shiba Inu price.
Author

Tony M.
FXStreet Contributor
Tony Montpeirous began investing in cryptocurrencies in 2017. His trading style incorporates Elliot Wave, Auction Market Theory, Fibonacci and price action as the cornerstone of his technical analysis.



