Shiba Inu Price Prediction: Time to look for a pullback?
- Shiba Inu price consolidates after rallying 60% since January 1.
- Higher time frame indicators suggest SHIB is in a make-or-break situation.
- A 3-day candlestick close above $0.00001280 would void the pullback scenario.

Shiba Inu price is cooling down after an impressive first leg up to start the new year. The technicals now suggest a pullback is on the horizon. Thus, traders should apply caution while trading the notorious meme coin.
Shiba Inu price in make-or-break
Shiba Inu price has created a new narrative for itself as the digital dog coin has risen by 60% since January 1. The surge has gone fully impulsive, creating a nearly vertical trendline.
Shiba Inu currently trades at $0.00001202. While the smaller time frames have shown a significant increase in volatility, the larger time frames are still waiting for a clear depiction of what lies ahead. The Relative Strength Index (RSI), an indicator used to gauge kinetic potential by comparing and contrasting previous swing points, shows the Shiba Inu price at a significant resistance level in the 3-day time frame.
At the time of writing, the SHIB rally is at the 70 levels on the RSI, a fundamental level where corrections usually occur. A 3-day candlestick close with the RSI above the 70 level would be a significant cue that the uptrend is the start of a much larger rally for the coming weeks. Because the SHIB token remains suppressed, the possibility of a retracement remains prevalent. A descending trendline that connects the August high at $0.00001800 and the October high at $0.00001519 coincides with the call for cautionary measures, as it is currently acting as resistance above Shiba Inu's price.
Considering these factors, it may be time to expect the anticipated pullback. The untested 21-day simple moving average is a plausible target positioned at $0.00001000. A retest of the barrier would result in an 18% decline from SHIB's current market value.
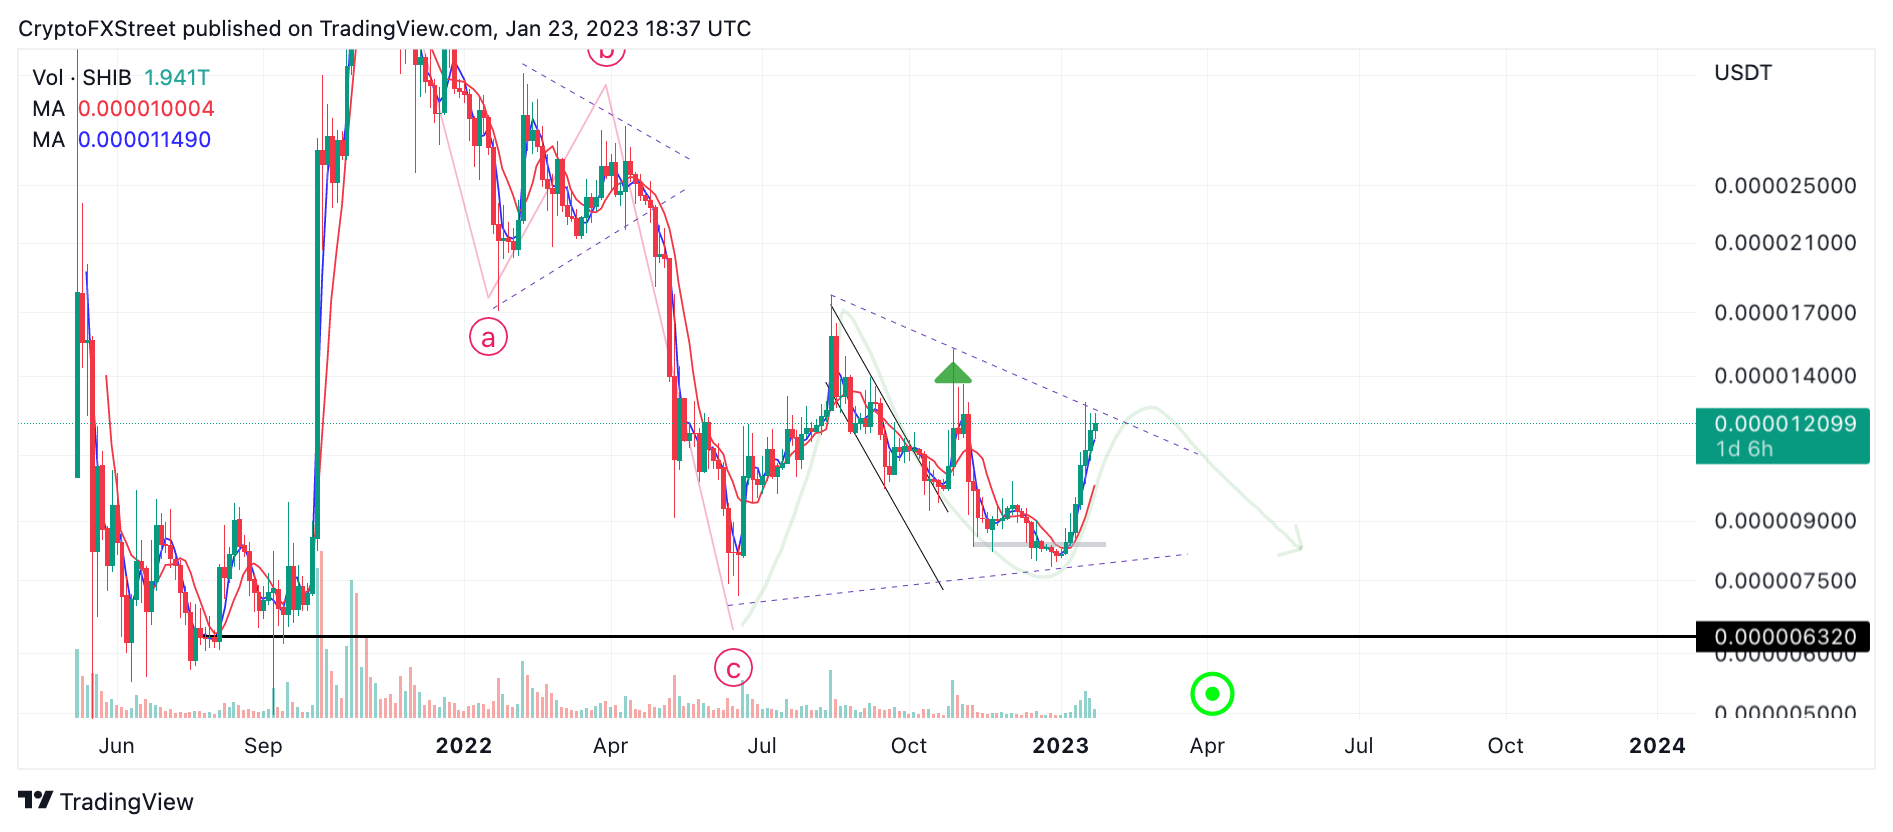
SHIB/USDT 3-day chart
A 3-day candlestick close above the ascending trend line at $0.0001280 or an RSI hurdle above 70 is needed to negate the bearish potential. If either scenario occurs, the bulls could continue north, targeting the October and August highs resulting in up to a 50% increase from the current Shiba Inu price.
Author

Tony M.
FXStreet Contributor
Tony Montpeirous began investing in cryptocurrencies in 2017. His trading style incorporates Elliot Wave, Auction Market Theory, Fibonacci and price action as the cornerstone of his technical analysis.



