Shiba Inu Price Prediction: Are SHIB bulls paddling toward a waterfall?
- Shiba Inu price rose by 27% last week.
- SHIB's recent hurdle comes with inherent risk to the downside.
- Invalidation of the bearish thesis is a breach above $0.00001516.
Shiba Inu price has witnessed an impressive rally throughout January. Still, caution may need to be exercised as larger time frames do not show the ideal bullish signals.
Shiba Inu price capped for gains?
Shiba Inu price has investors honing in as the influx of volatility throughout the month has created several profitable opportunities for day traders to partake. As a brief pause occurs in the market, the technicals point north but dually show reasons to be skeptical of the uptrend's long-term potential.
Shiba Inu currently trades at $0.00001037. The Relative Strength Index (RSI), an indicator used to assess trend potential by comparing and contrasting previous pivot points, shows a peculiar situation. On the daily time frame, the indicators are undoubtedly bullish, breaching overbought conditions above the 70 level during the recent rally. Unfortunately, the weekly RSI was barely fazed by the surge. In fact, the spike remains in the neutral zone and shows a hidden bearish divergence.
This could be a subtle cue that early bulls in the market are paddling towards a waterfall, at risk of liquidation in the coming weeks. If this is the case, the recent origin point at $0.00000800 could succumb to a challenge, resulting in a 25% decrease from the present SHIB price.
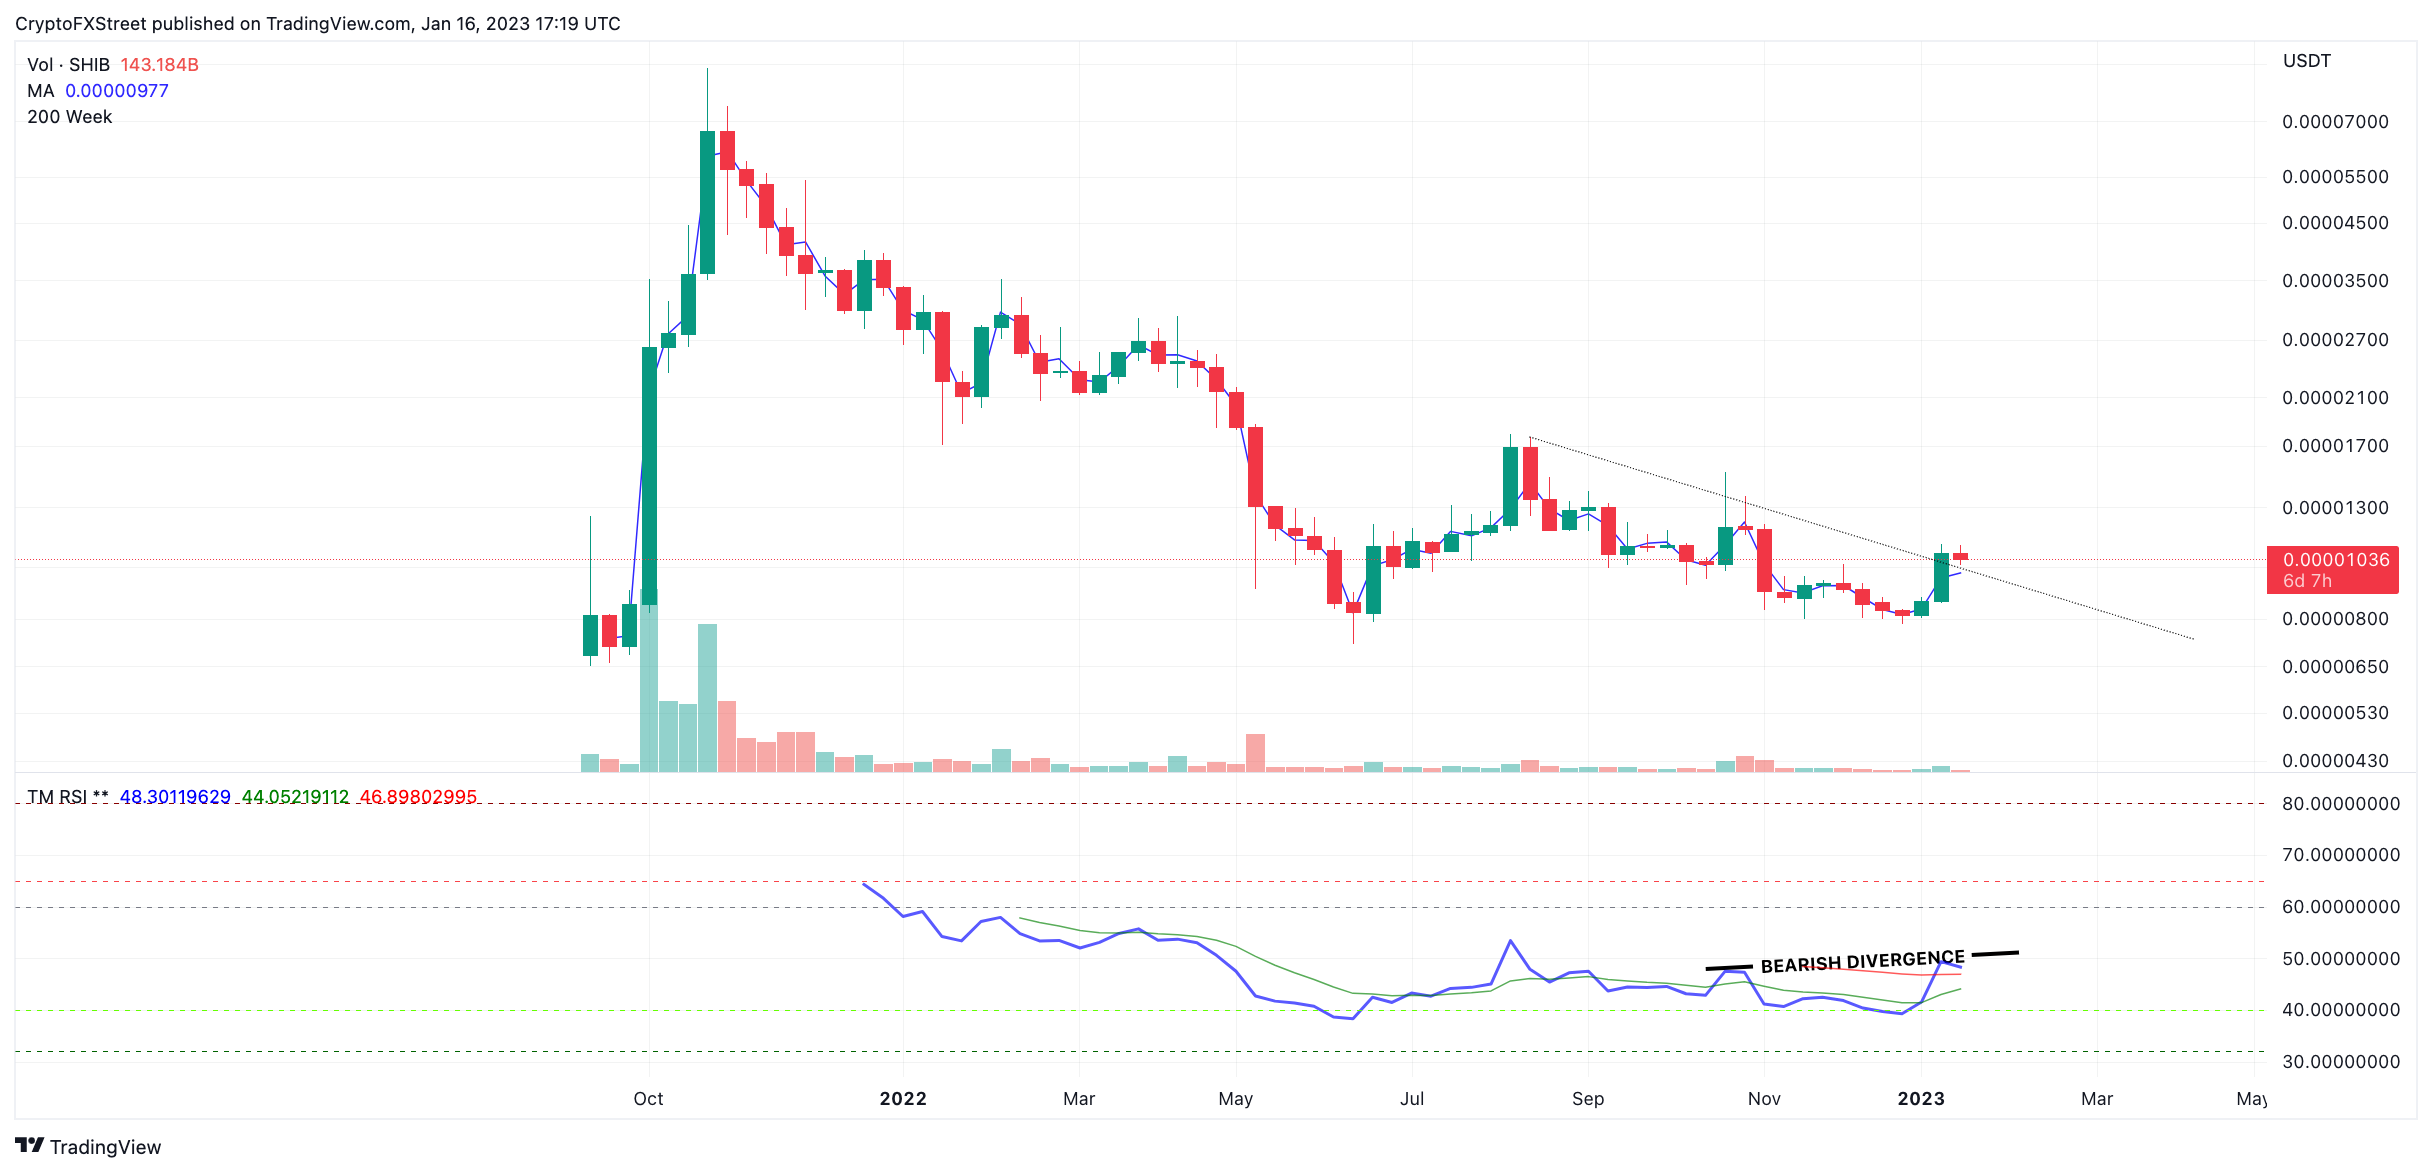
SHIB/USDT 1-Week chart
Furthermore, the liquidity level above the hidden bearish divergence may be where the smart money is qualifying SHIB's future uptrend potential. A breach above the aforementioned level at $0.00001516 could invalidate the bearish thesis and set up a rally toward the August high at $0.00001793, resulting in a 75% increase from Shiba Inu's current market value.
Author

Tony M.
FXStreet Contributor
Tony Montpeirous began investing in cryptocurrencies in 2017. His trading style incorporates Elliot Wave, Auction Market Theory, Fibonacci and price action as the cornerstone of his technical analysis.


