Shiba Inu price plunges below $0.00001 again – why losses could stretch to $0.0000075
- SHIB bulls may have a chance to arrest declines at $0.00000925 support.
- Shiba Inu price could be far from tagging a floor price while its token burn rate diminishes.
- Sellers setting camp at $0.00001100 may keep SHIB price suppressed longer than expected.

Shiba Inu price is at a crucial juncture that will determine the direction of future price action. The second-largest meme coin could regain ground above $0.00001000 if investor sentiment flips bullish. However, the risk of sliding to $0.00000750 as it hunts for support cannot be ruled out.
Shiba Inu burn rate falls 34.45% in 24 hours
The Shiba Inu ecosystem has, over the last few months, burned approximately 410 trillion tokens from its initial maximum supply of 999 trillion tokens. According to data from Shibburn, a platform used to track the token burn program, Shiba Inu now has a total supply of 589 trillion, of which 559 trillion tokens are in circulation. Holders are staking slightly above 29 trillion SHIB.
Although the token burn process has been publicized as the most effective way to help Shiba Inu price regain its past glory by reversing the trend from its historical high, fewer tokens are currently being axed from existence. Shibburn highlights a 34.45% drop in the burn rate over the last 24 hours, with only 17 million SHIB burned in that period.
-638019648221043691.png)
Shiba Inu token burn rate
The token burn program is important to Shiba Inu price performance, but investors are yet to feel its impact due to the bear market in 2022. Perhaps the lack of a positive reaction is sucking up hope from investors, which could explain the significant decrease in the token burn rate.
Shiba Inu bearish momentum to continue
Shiba Inu price currently holds above support established at $0.00000925. Although overhead pressure on SHIB has reduced significantly, after tagging this support, movement to the upside has been capped by seemingly strong resistance at $0.00001000.
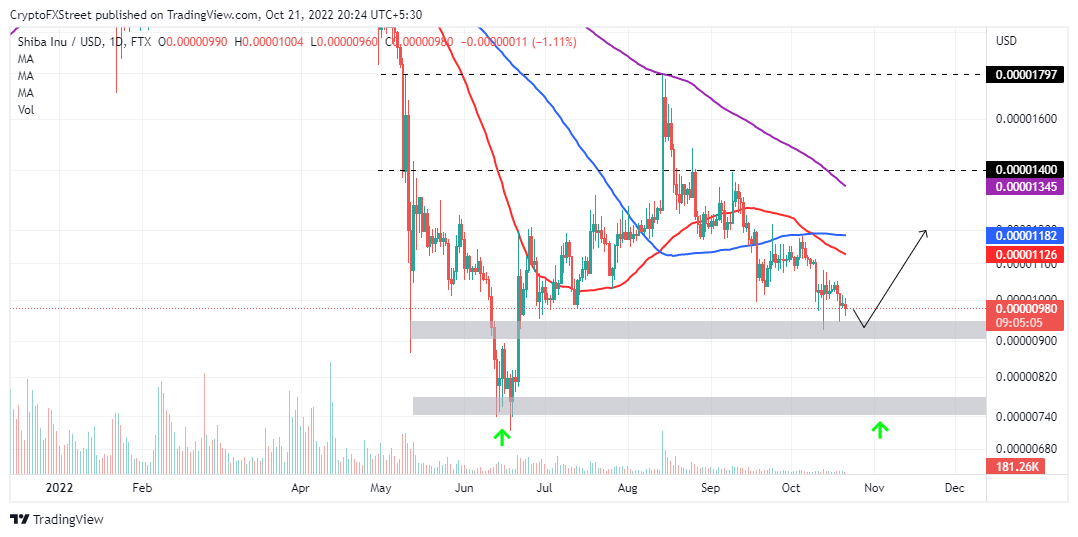
SHIB/USD daily chart
The 50-day SMA (Simple Moving Average), red, validated SHIB’s downtrend as it crossed below the 100-day SMA, blue, at $0.00001186. If support at $0.00000925 shatters, Shiba Inu may consider seeking more robust support at $0.00000750. SHIB tested this buyer concentration area in June before respecting and launching a recovery move to its most recent peak at $0.00001800.
On the flip side, a rise above $0.00001000 could prepare Shiba Inu price for another attack on the seller congestion zones at $0.00001100, $0.00001400 and $0.00001800.
Author

John Isige
FXStreet
John Isige is a seasoned cryptocurrency journalist and markets analyst committed to delivering high-quality, actionable insights tailored to traders, investors, and crypto enthusiasts. He enjoys deep dives into emerging Web3 tren




