- Shiba Inu price witnessed a bearish death cross on the daily time frame on December 13.
- SHIB trades range bound within a 10% fluctuating zone on the week.
- The bulls will need to flip the 0.00000932 barrier into support to justify a bullish outlook.
Shiba Inu price could be setting up for a downtrend surge. At the time of writing, the bulls show early signs of failure. If market conditions persist, a sweep-the-lows event will be imminent.
Shiba Inu price under pressure
Shiba Inu price is witnessing an ongoing consolidation as the notorious meme coin coils within a 10% range on the week. On December 13, a bearish cross was spotted on the daily chart as the 21-day simple moving average treaded over the 8-day exponential moving average while SHIB remained submerged.
Since the signal, the bulls have been rejected near the $0.00000900 barrier on smaller time frames. Bearish crosses are often referred to as a “death cross” amongst traders as the crossing of the slower moving average into the faster one usually results in sharp liquidations.
Shiba Inu currently trades at $0.00000885. A second retest of the intersected indicators will be unnecessary if the market is genuinely bearish. A piercing of the December 13 low at $0.00000861 could prompt a bear rally targeting the November swing low at $0.00000817 for a 7% decline. If bulls remain sidelined near the November bottom, then SHIB will likely print new yearly lows in the coming weeks.
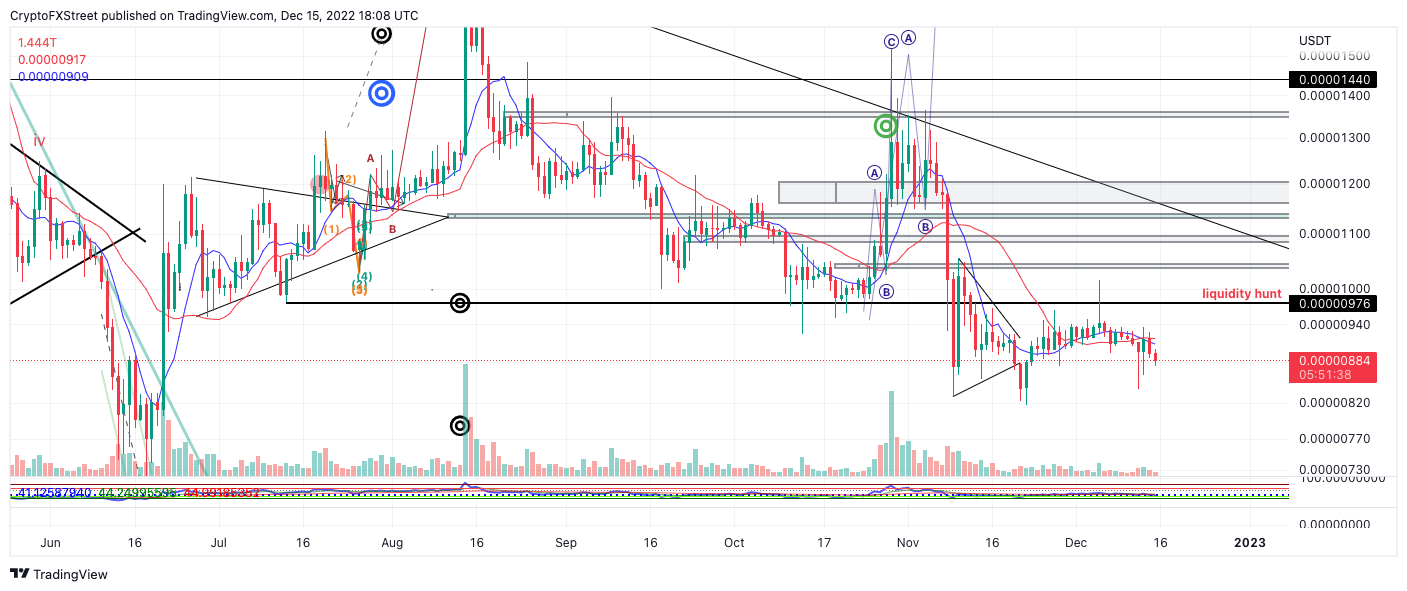
SHIB/USDT 1-day chart
As mentioned in the previous outlook, a bullish attempt at the December 13 swing high at $0.00000932 is required to consider aiming for higher targets. If the bulls can flip the barrier into support, SHIB could rally as high as the November 10 swing high at $0.00001055. The Shiba Inu price would rise by 19% under the bullish scenario.
Information on these pages contains forward-looking statements that involve risks and uncertainties. Markets and instruments profiled on this page are for informational purposes only and should not in any way come across as a recommendation to buy or sell in these assets. You should do your own thorough research before making any investment decisions. FXStreet does not in any way guarantee that this information is free from mistakes, errors, or material misstatements. It also does not guarantee that this information is of a timely nature. Investing in Open Markets involves a great deal of risk, including the loss of all or a portion of your investment, as well as emotional distress. All risks, losses and costs associated with investing, including total loss of principal, are your responsibility. The views and opinions expressed in this article are those of the authors and do not necessarily reflect the official policy or position of FXStreet nor its advertisers. The author will not be held responsible for information that is found at the end of links posted on this page.
If not otherwise explicitly mentioned in the body of the article, at the time of writing, the author has no position in any stock mentioned in this article and no business relationship with any company mentioned. The author has not received compensation for writing this article, other than from FXStreet.
FXStreet and the author do not provide personalized recommendations. The author makes no representations as to the accuracy, completeness, or suitability of this information. FXStreet and the author will not be liable for any errors, omissions or any losses, injuries or damages arising from this information and its display or use. Errors and omissions excepted.
The author and FXStreet are not registered investment advisors and nothing in this article is intended to be investment advice.
Recommended Content
Editors’ Picks
Polkadot Price Forecast: DOT confirms trend reversal, eyes retest of $5 after reclaiming key hurdle

Polkadot seems to be ending its downtrend after shedding 92.91% in the last two years from its all-time high of $55.09. In the last three days, DOT has inflated by 3.3%, breaching a declining trendline and confirming the potential start of an uptrend.
Floki Inu Price Forecast: FLOKI sets stage for 30% rally

Floki Inu price rallied nearly 20% on September 30 but closed the candlestick with a 12% gain. The recent uptick opens the possibility of a 30% rally for FLOKI holders. A daily candlestick close below the $0.0000160 level would invalidate the bullish thesis.
Binance Coin Price Prediction: BNB struggles will end after reclaiming $228

Binance Coin (BNB) price has been in a tight consolidation for nearly six weeks. But the range tightening could end soon, potentially allowing bulls to take over and attempt to flip multiple hurdles standing in their way.
Solana Price Forecast: SOL big picture to flip bullish soon, all eyes on $26

Solana (SOL) price seems to be undoing the bearish pressure that has kept it subdued all this time. The recent spike in buying pressure has pushed SOL to produce a higher high on the three-day chart, signaling a shift in momentum favoring bulls.
Bitcoin: BTC recovery rally could be bull trap in disguise, here’s why

Bitcoin (BTC) price remains unfazed even after the multiple spot BTC ETF delays from the US Securities & Exchange Commission (SEC). But investors need to be careful with the ongoing BTC rally as it could be a trap for early bulls.