Shiba Inu price remains bound to a downtrend under these on-chain metrics
- Shiba Inu price declined by 8% before quickly producing a countertrend defense.
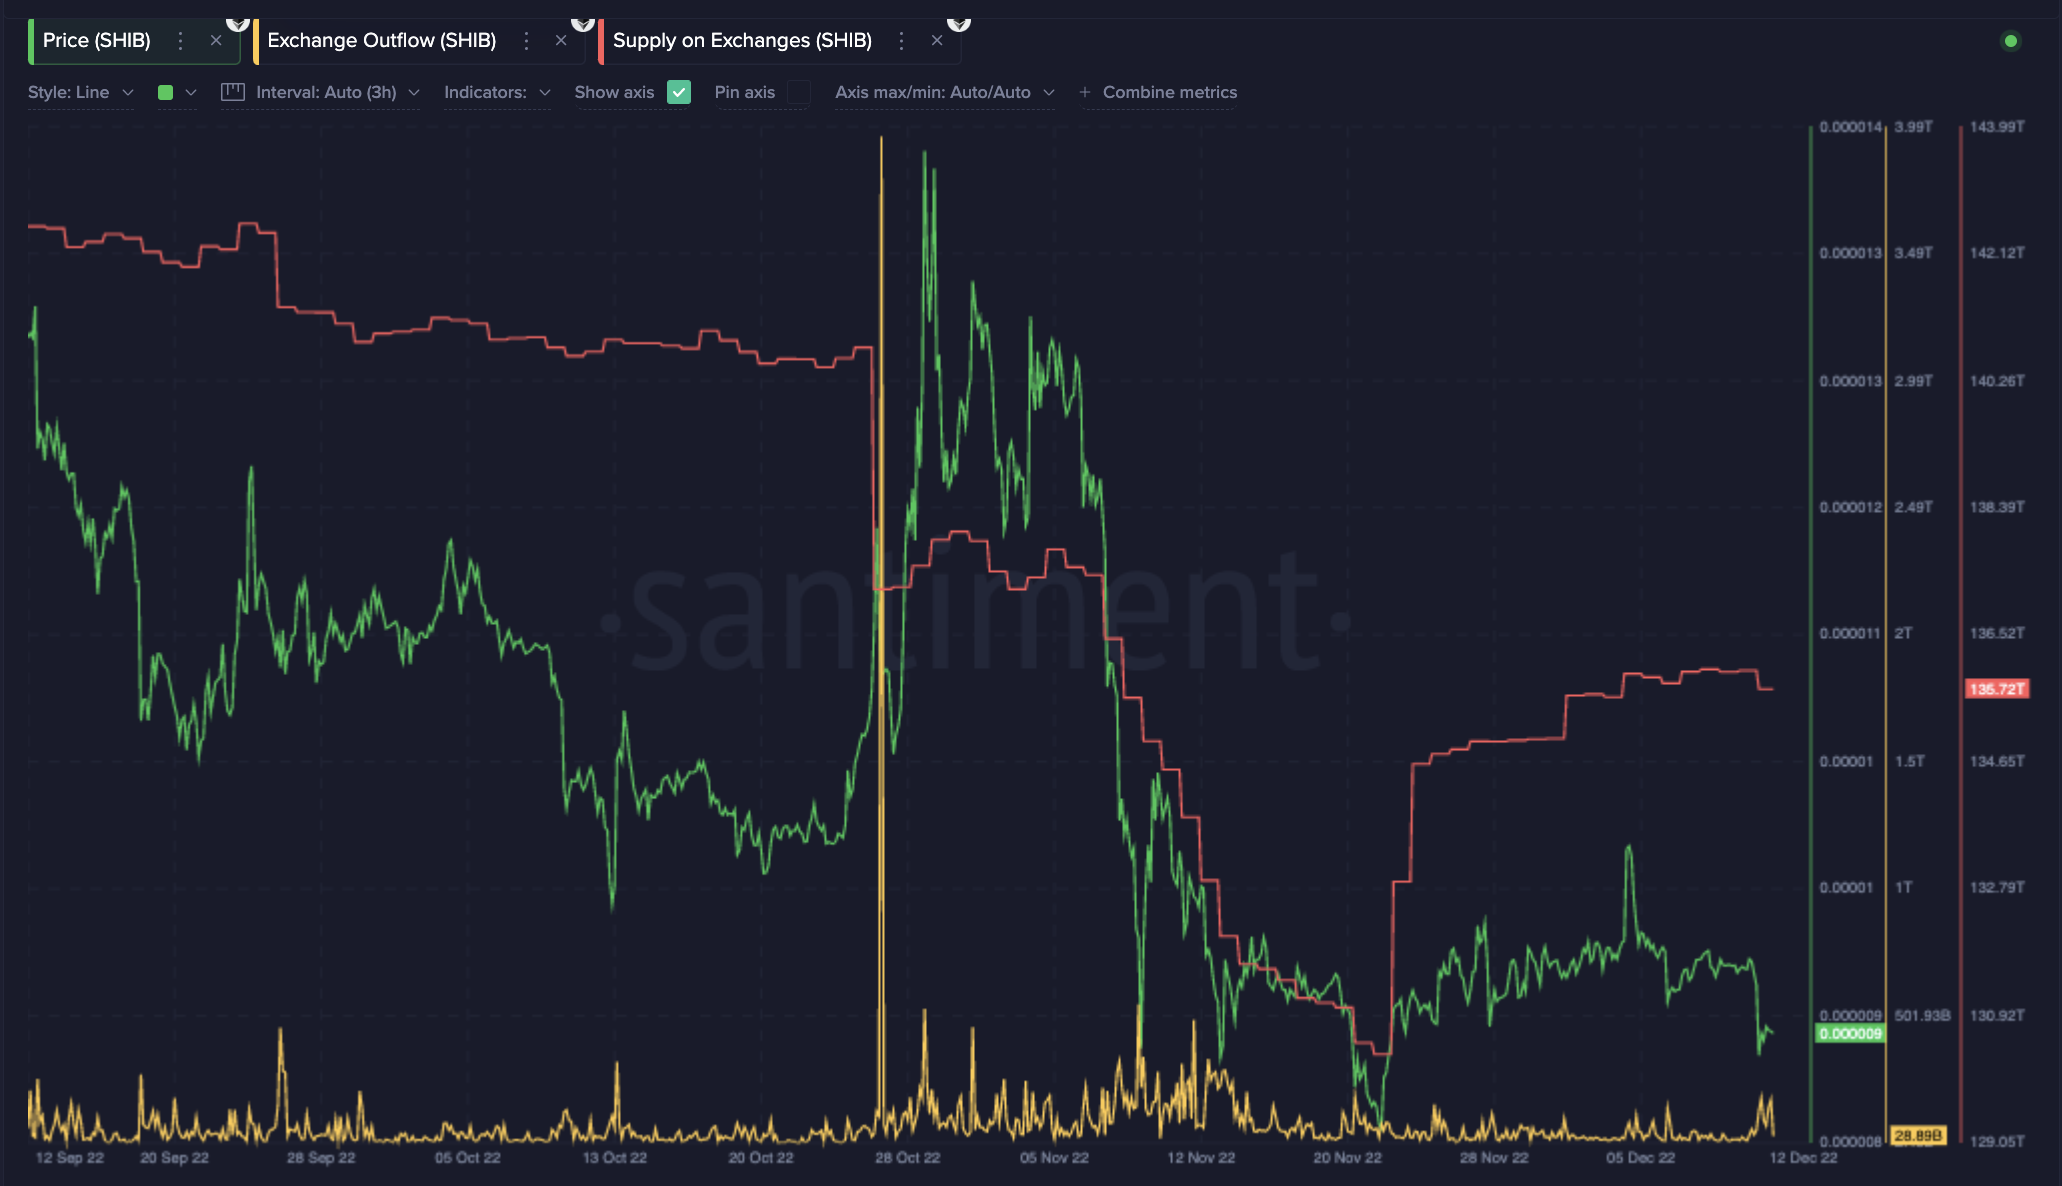
- On-chain metrics show exchanges have increased the SHIB supply by 5 trillion tokens.
- A breach above $0.00000932 is needed to consider aiming for bullish target zones.
Shiba Inu price is putting up a fight against the bearish force, but on-chain metrics show the downtrend is unfazed. Countertrend scalping the SHIB price could become problematic as the potential for a strong sell-off lingers underneath the notorious meme coin's hood.
Shiba Inu price in a downtrend
Shiba Inu price has been on the bearish stronghold for most of the year. On December 12, after trading range bound for several weeks, the SHIB price dove south in an attempt to wipe out the November low at $0.00000817. The bulls jumped in just before the liquidation was accomplished and have since forged a 5% countertrend retaliation.
Shiba Inu currently trades at $0.00000882. While the bullish attempt to prevent the liquidation is applaudable in its own right, on-chain metrics still suggest bulls in the market have inherent risk. Since November 22, the supply of Shiba Inu on all crypto exchanges has increased from 130 to 135 trillion. The last time 135 trillion tokens were accounted for on the exchanges was on November 7, when SHIB briefly paused near the $0.00001100 price zone. A countertrend pullback was attempted but ultimately failed so SHIB could decline by an additional 30% in the following days.
It is worth noting that Shiba Inu's Exchange Outflow indicator remains relatively repressed. In December, the indicator saw an uptick from 35 billion to 120 billion, but the slope of the trend abruptly failed afterward. At the time of writing, the average daily outflow is back within the 30 billion token range, a common zone SHIB tends to operate during bear market conditions.
A breach above the previous swing high at $0.00000932 is needed to create the potential for more uptrend gains. A barrier hurdle could induce a challenge of the December high at $0.00001020. The Shiba Inu price would rise by 15% if the bullish scenario were to occur.
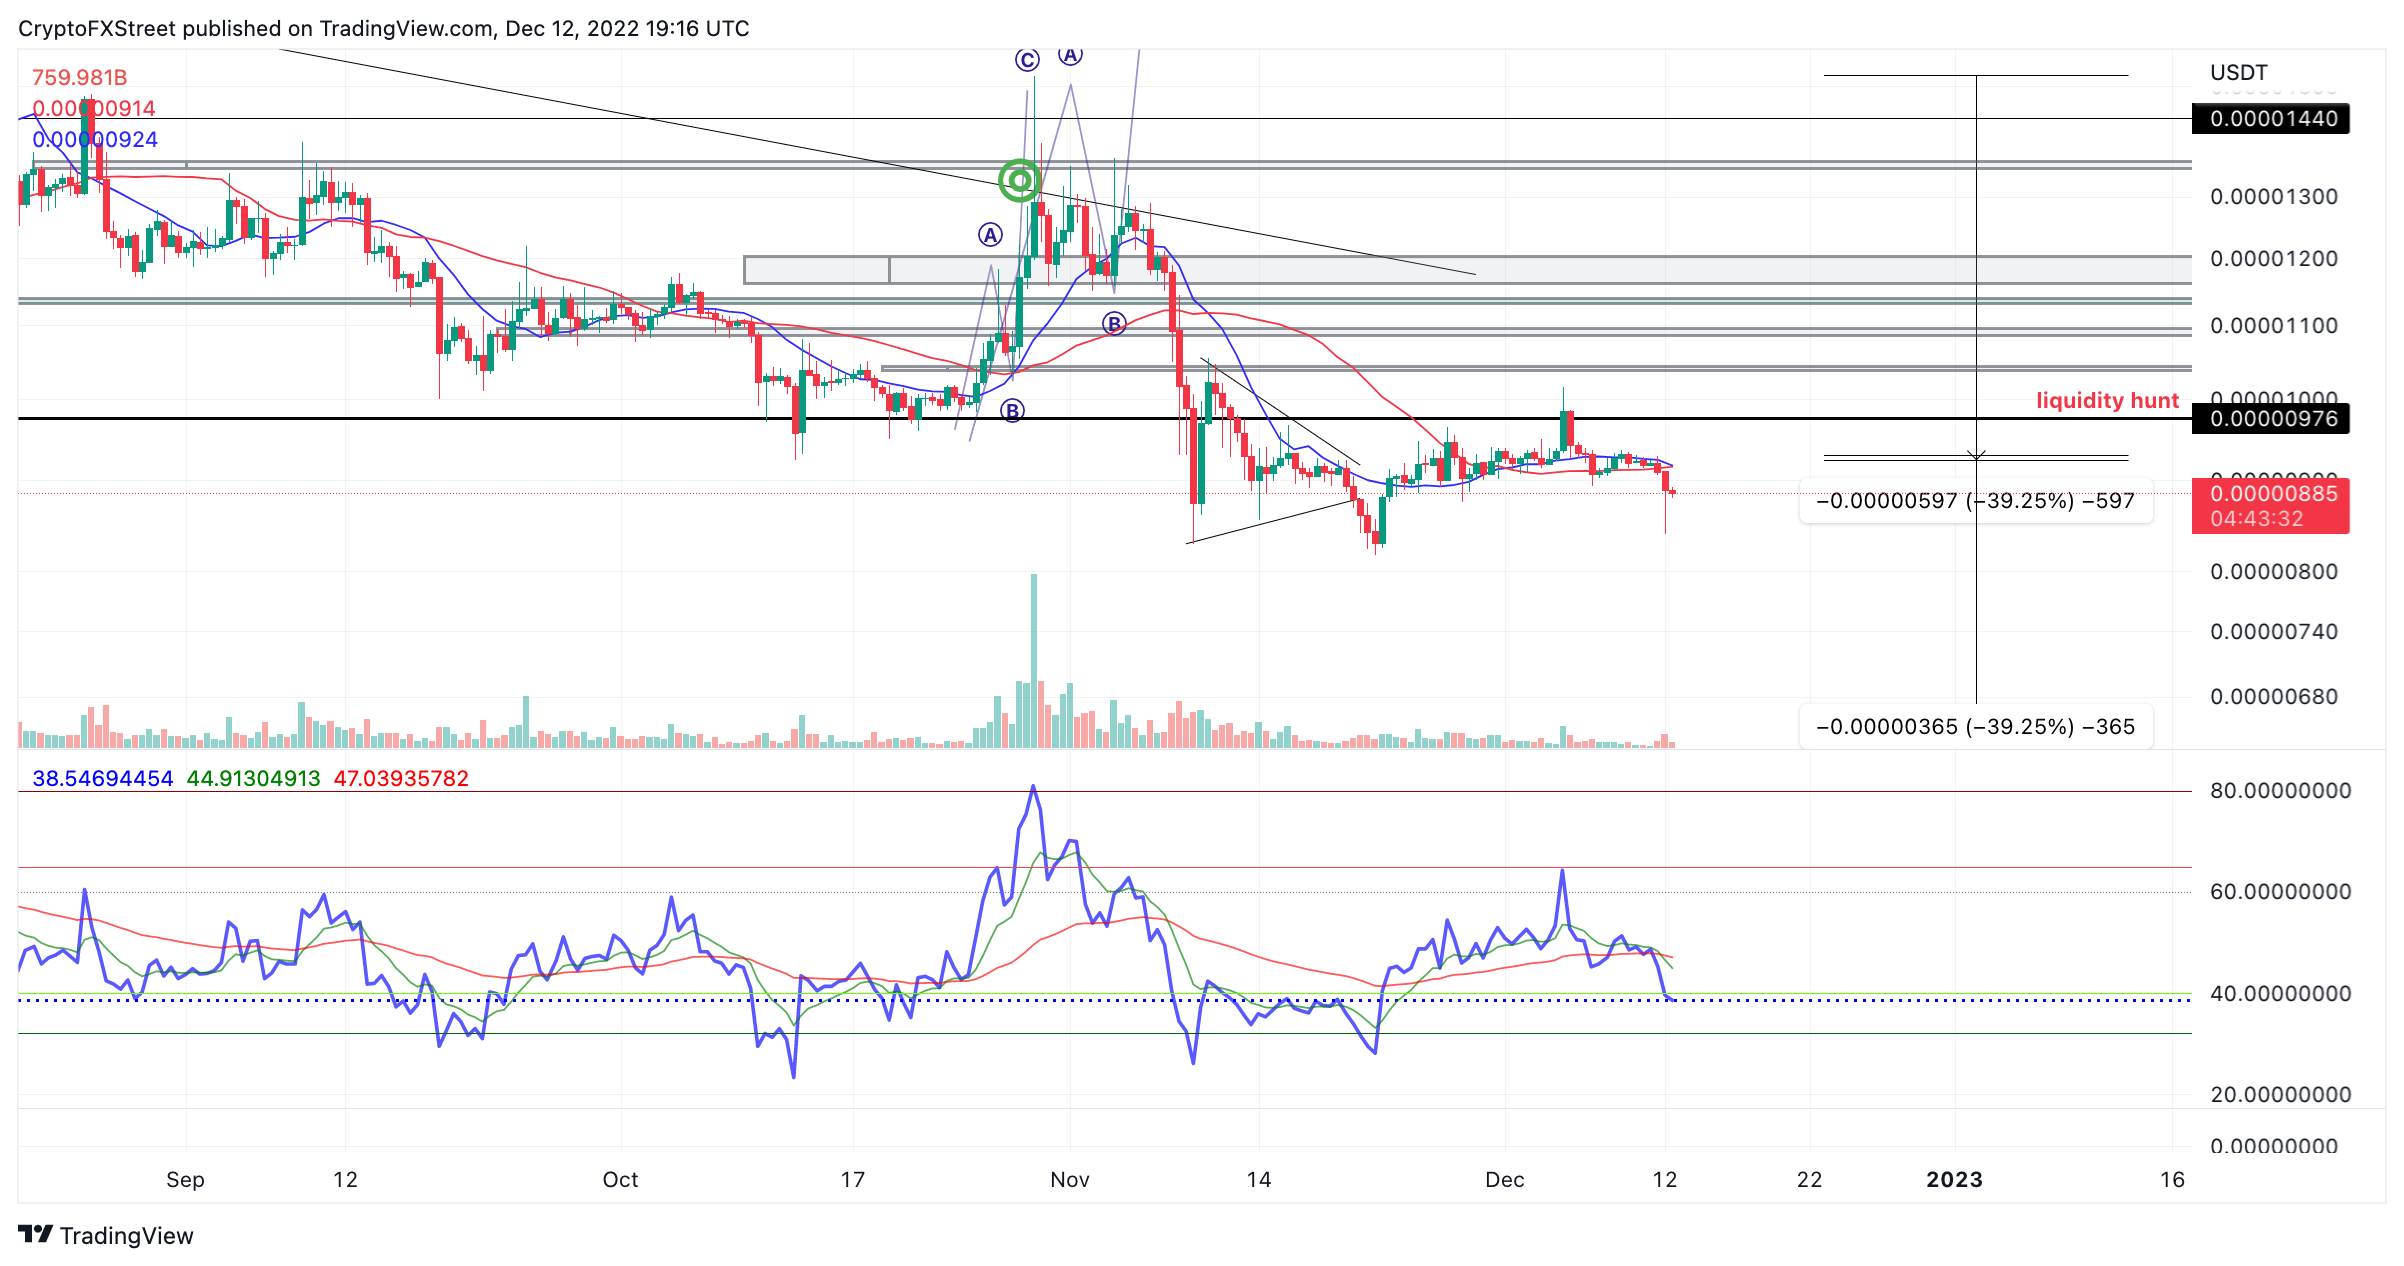
SHIB/USDT 12-hour chart
Author

Tony M.
FXStreet Contributor
Tony Montpeirous began investing in cryptocurrencies in 2017. His trading style incorporates Elliot Wave, Auction Market Theory, Fibonacci and price action as the cornerstone of his technical analysis.


