Shiba Inu price is broken as it does not represent current market turmoil
- Shiba Inu price moved in a tight range this week, not going anywhere.
- SHIB price should be moving with several asset classes in financial markets.
- A disjoint could point to a possible meltdown in the price action, or the absence of normal volume, making price action go nowhere.
Shiba Inu (SHIB) price action has been flirting with both sides of the trading spectrum and has not moved that much between bears and bulls. It has taken until the weekend to see a sense of direction finally, and taking these elements into account against the current volatile week in financial markets points to an issue. That issue is that SHIB price action is broken, is trading on low volume, and will soon be caught up with the trading reality.
SHIB price at risk of catching up with the tail risks at hand
Shiba Inu price has been flirting throughout the week up and down alongside the red descending trend line that has been hanging over the price action since mid-August. That is not an issue, as this could point to bears defending the trend line and setting up a bull trap while bulls want to stage a breakout and trigger a rally away from the trend line. It is strange, though, to see such muted price reaction as global markets were literally on fire for almost four straight trading days.
SHIB price thus has some catching up to do on reality, as several asset classes have moved sharply, while SHIB price seems to be unphased by the bulk moves that triggered markets from rolling over. One reason could be that the price action is still underpinned by $0.00001011, but do not expect that to hold against the large list of tail risks that soon will start to weigh on SHIB price action. Once that happens, expect a sharp decline towards $0.00000712, and say goodbye to that $0.00001000 barrier.
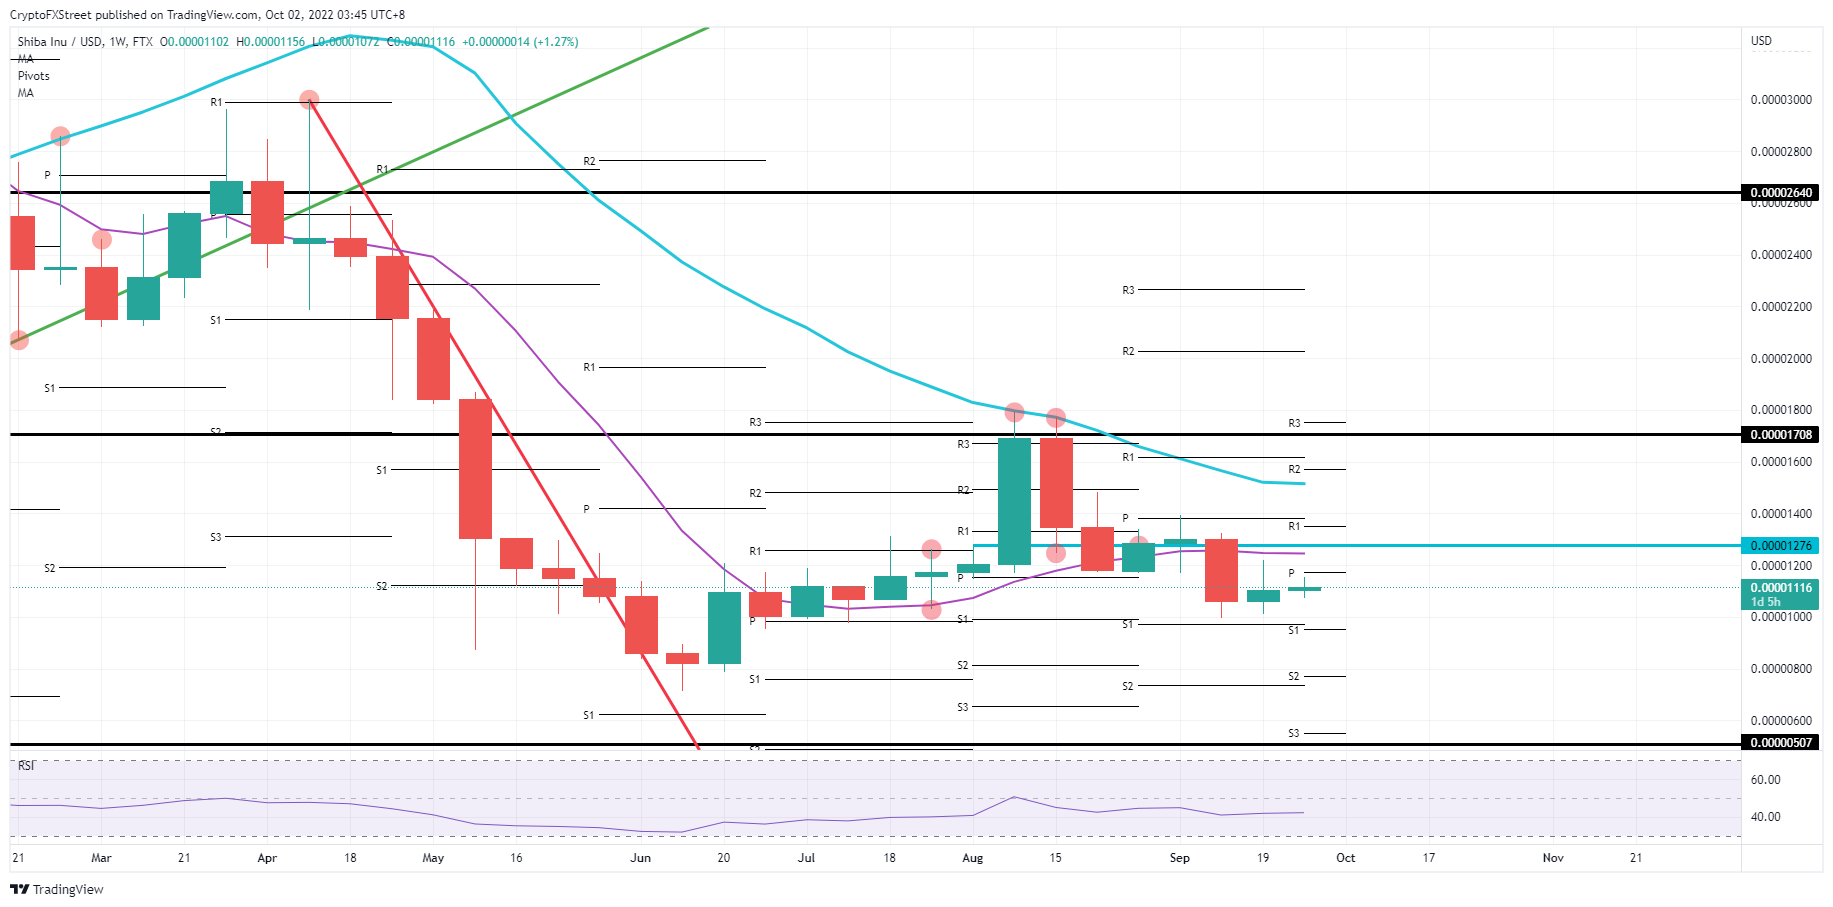
SHIB/USD Weekly chart
Even if the SHIB price can trade away from the red descending trend line, the next issue arises with the 55-day Simple Moving Average (SMA) coming up as the first price cap at $0.00001245. If that one would not limit the rally, the 200-day SMA will certainly do that for the bears at $0.00001500 as it did over the summer months. So either way, it is a question of how sustainable any rally will be, as the tail risks are just too many to count or bear.
Author

Filip Lagaart
FXStreet
Filip Lagaart is a former sales/trader with over 15 years of financial markets expertise under its belt.


