Shiba Inu: It’s more dump than pump as SHIB burning rate drops 88%
- Shiba Inu price shows more weakness within a falling channel.
- SHIB token burning rate plummets by a whopping 88% in the last 24 hours.
- Price recovery remains elusive amid concerns that SHIB could drop to $0.00008000.

Shiba Inu price seems nowhere close to bringing its year-long downtrend to an end. Although the second-largest cryptocurrency rebounded from support at $0.000007150 in June, its uptrend was rejected at $0.00001801 in mid-August.
Since then, price action has been confined in a falling channel, with limited bullish retracements. At the time of writing, SHIB price exchanges hands at $0.00001101 amid increasing downside risk that could see it slide below $0.00001000.
SHIB token burn rate retraces as Shiba Inu price hunts for support
Shib Super Store has recently indirectly launched a SHIB token burn program via Amazon. The platform spends the commissions it receives from sales made on Amazon to purchase SHIB tokens which are later pulled out of circulation. The affiliate program has burned around 192,169,000 SHIB tokens worth $2,115 at the current market rate.
September 27!
— SHIB Super Store (@shib_superstore) September 28, 2022
$67 yesterday bringing us up to $2135 for the month!
3 days left, let's make them count!
With the upcoming holiday shopping season coming up, why not burn SHIB while shopping?
Use our Amazon affiliate link: https://t.co/2r86esC83U
Commission table below pic.twitter.com/SQSkLZ70ft
Despite the new indirect Shib Super Store burn program, the cumulative burn rate in the last 24 hours dropped by more than 88%, according to Shibburn. Roughly 7,050,000 SHIB tokens had been deposited in unspendable wallets, compared to 59,638,305 in the previous 24-hour period.
Is Shiba Inu price rally waiting for lower support?
The falling channel’s upper boundary caps Shiba Inu price’s upside in conjunction with the 100 SMA (Simple Moving Average – blue). Movement north of support provided by the channel’s lower boundary at $0.00001000 may be less impactful due to the low trading volume observed from the leveling OBV (On Balance Volume).
Similarly, the Direction Movement Index (DMI) has no bullish or bearish bias. In other words, investors are undecided on the direction Shiba Inu price will take in the short-term.
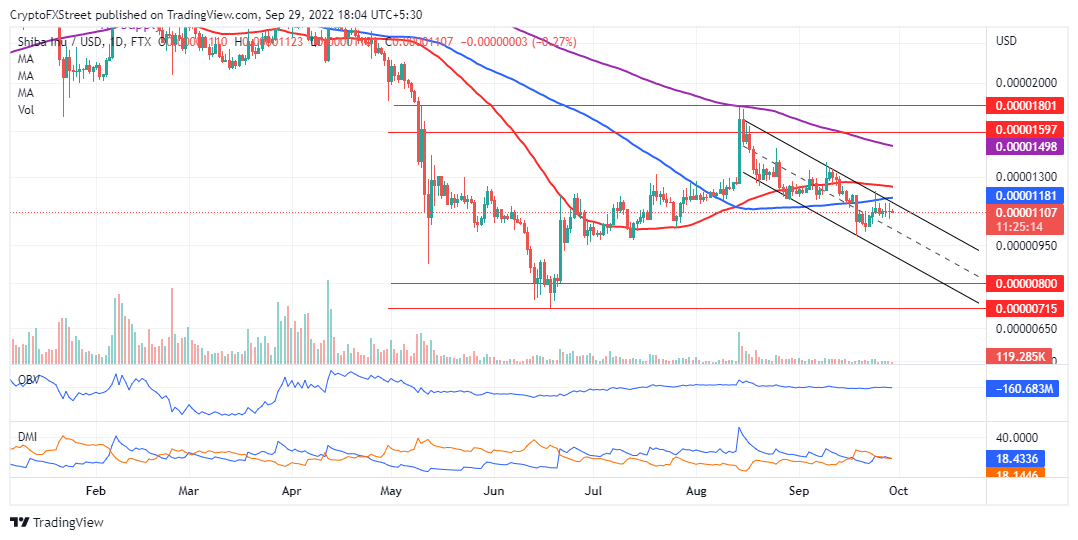
SHIB/USD daily chart
If Shiba Inu price continues to move within the falling channel, investors should start acclimatizing to declines below $0.00001000. SHIB may need to collect more liquidity while forming a double-bottom pattern at its previous support – $0.00000715 in June.
The IOMAP on-chain model by IntoTheBlock cements the bears’ firm grip on Shiba Inu by highlighting an intense seller congestion zone around $0.00001100. Approximately 14,600 addresses previously purchased 59.88 trillion SHIB tokens in the area.
-638000566123017189.png)
Shiba Inu IOMAP chart
As Shiba Inu price tries to reach out for a breakout, investors within the range may sell at their various breakeven points, which would create more selling pressure, ultimately leading to a pullback.
Author

John Isige
FXStreet
John Isige is a seasoned cryptocurrency journalist and markets analyst committed to delivering high-quality, actionable insights tailored to traders, investors, and crypto enthusiasts. He enjoys deep dives into emerging Web3 tren




