Shiba Inu price is about to recover after this bullish breakout
- Shiba Inu price is set to reboot its uptrend after a false break below.
- Expect to see a 35% upside towards $0.00002800, a vital level going forward.
- SHIB price is currently squeezed at the intersection of two major trendlines.

Shiba Inu (SHIB) price slipped below necessary support after experiencing bearish pressure from a downward trend line. Bulls, however, have kept any further fades contained and even revealed a squeeze to the upside. Despite four rejections against both the red descending trend line and the green ascending trendline Shiba Inu price is at least posting higher lows on a daily chart. Bullish pressure is mounting and is set to materialise in a pop above $0.00002400 that could lead to a rally up to $0.00002800 around the monthly R1 and the 78.6% Fibonacci level.
SHIB price set to restart its 2022 uptrend
Shiba Inu price slipped below the essential green ascending trendline that acted as the backbone for the uptrend throughout 2022 thus far after rejection from the red descending trendline to the topside. However, with higher lows, the stage looks set for a squeeze and pop higher as bullish momentum builds and the Relative Strength Index (RSI) builds up to the upside.
SHIB price thus will make its way across the intersection between the red and the green diagonal trend lines and, in the process, shift from a downtrend to an uptrend. One bullish indicator will be when the daily pivot at around $0.00002284 is turned back into support. From there, a quick jump looks set towards the monthly R1, just a few ticks away from the 78.6% Fibonacci level at $0.00002782, so presume $0.00002800 as the big figure target, booking 35% profit with it.
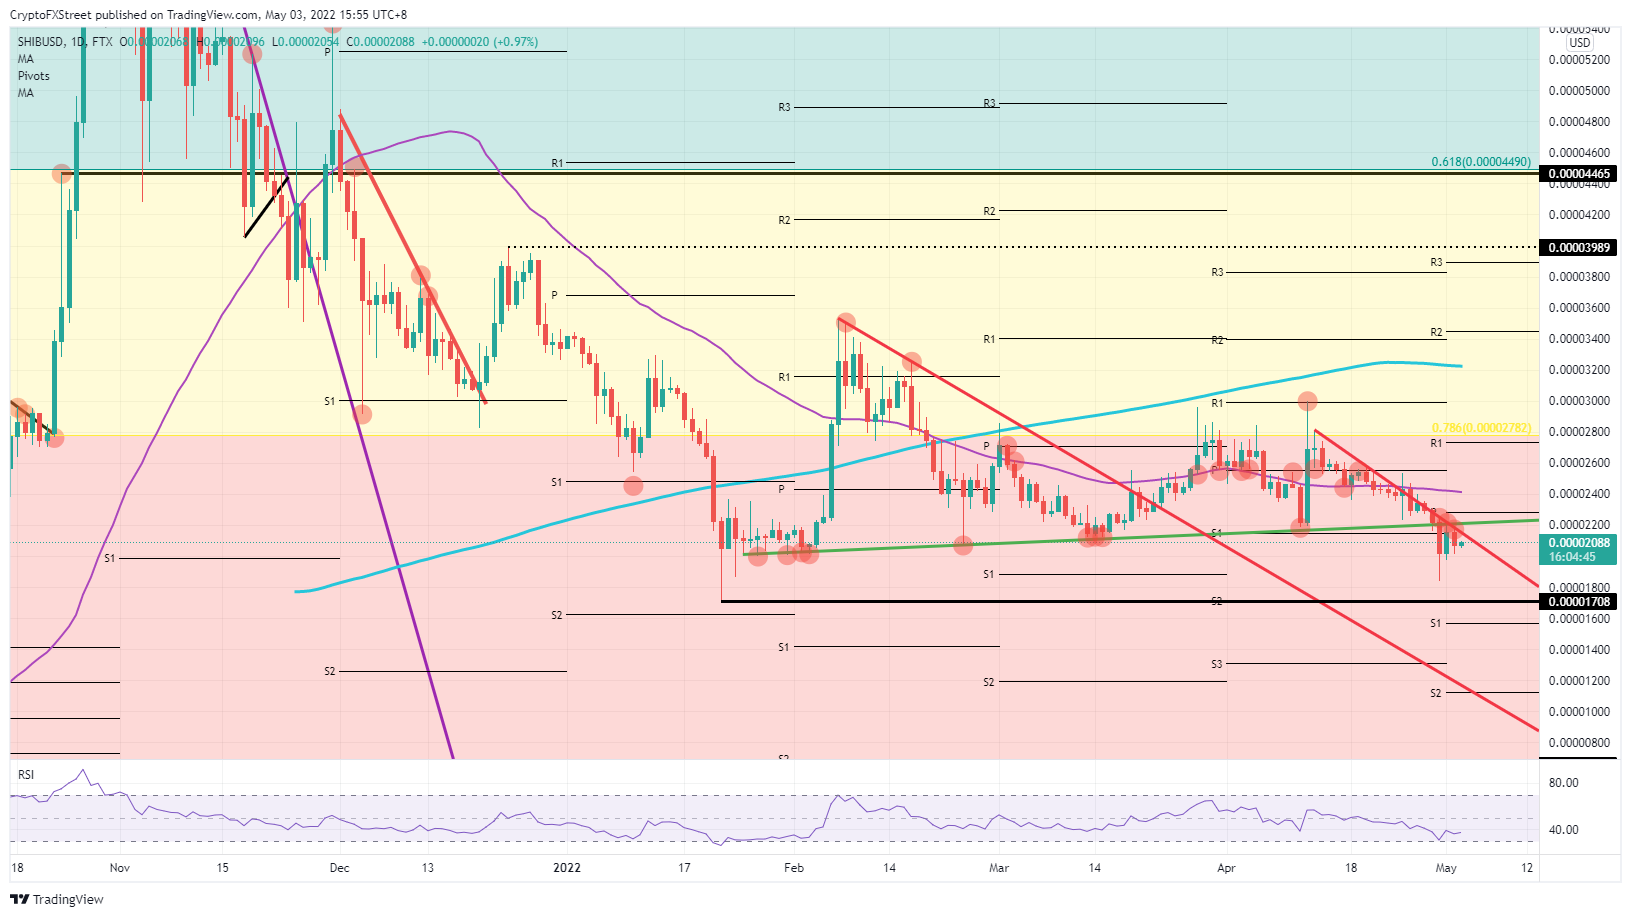
SHIB/USD daily chart
Risk comes with another fifth, firm rejection against the red descending trend line or the green ascending trend line. That could be a setback for bulls, triggering short-term profit-taking and creating a fade that could be extended to $0.00001708, dropping 22%. With that move, the RSI would hit the oversold barrier again and see a bullish reversal for the next attempt.
Author

Filip Lagaart
FXStreet
Filip Lagaart is a former sales/trader with over 15 years of financial markets expertise under its belt.



