Shiba Inu Price Forecast: SHIB could recover as it finds support around key level
- Shiba Inu's price hovers around $0.000021 on Tuesday after retesting and bouncing off from key support the previous day.
- Sideline investors looking to accumulate SHIB can do so in the $0.000019 to $0.000021 range.
- A daily candlestick close below $0.000019 would invalidate the bullish thesis.
Shiba Inu (SHIB) price hovers around $0.000021 on Tuesday after retesting and bouncing off from key support the previous day. Sideline investors looking to accumulate SHIB can do so at support levels from $0.000019 to $0.000021.
Shiba Inu price looks promising for a recovery rally
Shiba Inu’s price declined to retest its daily support level at $0.000019 on Monday. This support level coincides with its 61.8% Fibonacci retracement (drawn from the August 5 low of $0.000010 to the December 8 high of $0.000033), making it a key reversal zone. When writing on Tuesday, it trades slightly higher, above its 200-day Exponential Moving Average (EMA) at $0.000021.
Sideline investors looking to accumulate SHIB tokens can do so around $0.000019.
If the $0.000019 holds as support and SHIB closes above the $0.000022 weekly resistance, it could extend the rally to retest its next weekly resistance at $0.000028.
The Relative Strength Index (RSI) reads 44 in the daily chart, below its neutral level of 50, indicating a slight bearish momentum. However, the Moving Average Convergence Divergence (MACD) indicator flattens around its neutral level of zero, suggesting indecisiveness among traders.
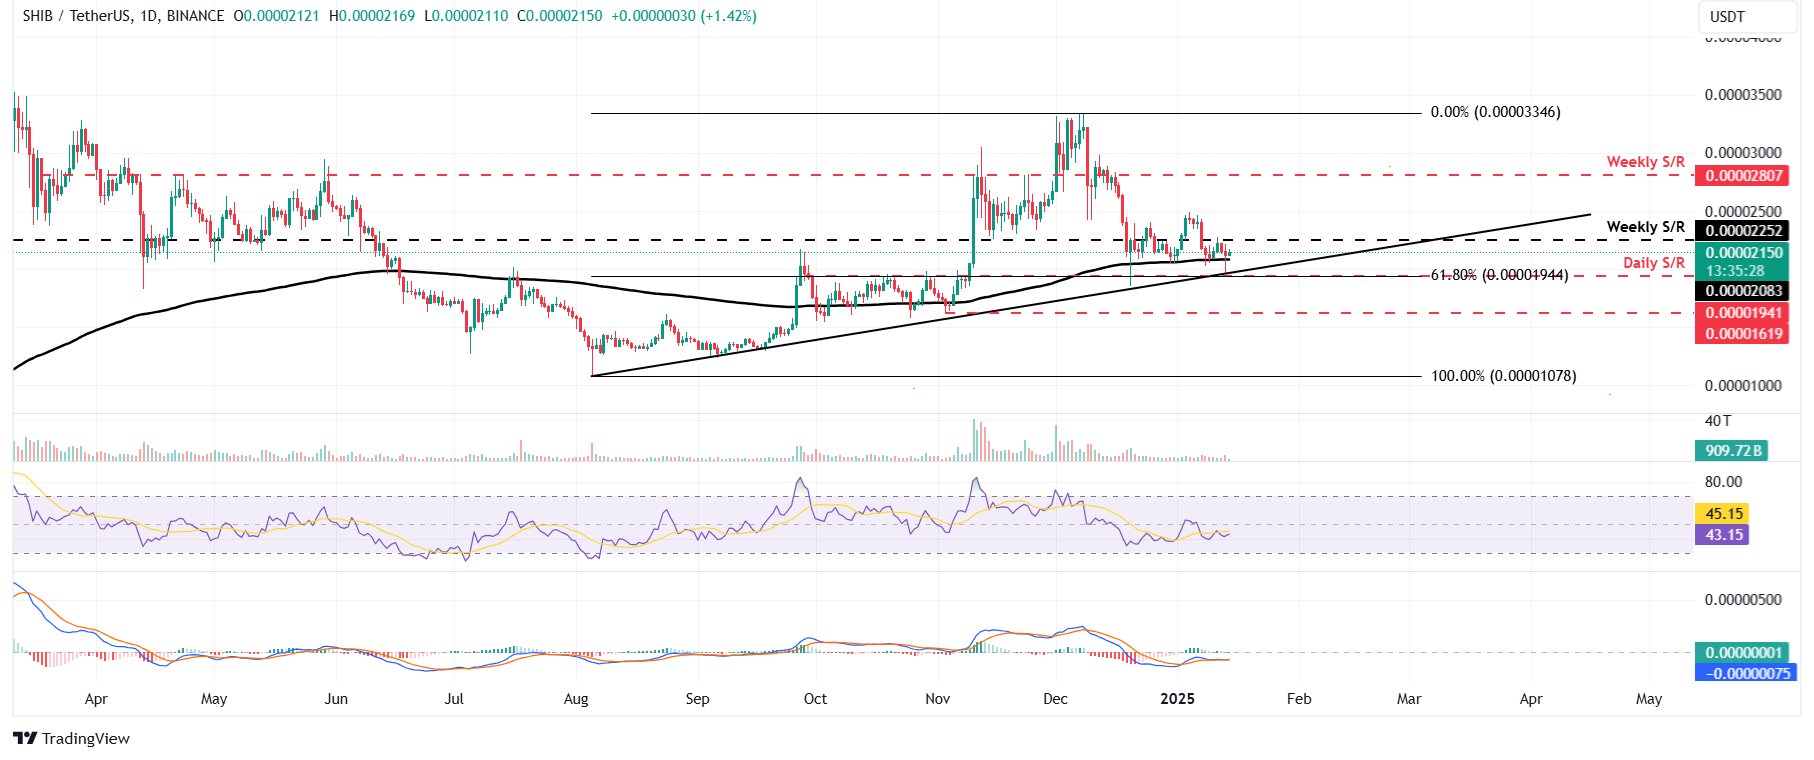
SHIB/INU USDT daily chart
However, on-chain data points to a bullish outlook for Shiba Inu price. According to IntoTheBlock’s In/Out of the Money Map (IOMAP), approximately 17,160 addresses bought 3.22 trillion SHIB tokens at an average price of $0.000021. If the price falls at this level, many investors may add more to their positions, making this a key reversal level to watch for.
From a technical analysis perspective, the $0.000019 to $0.000021 support level aligns with the IOMAP findings, marking this zone as a crucial reversal point to monitor.
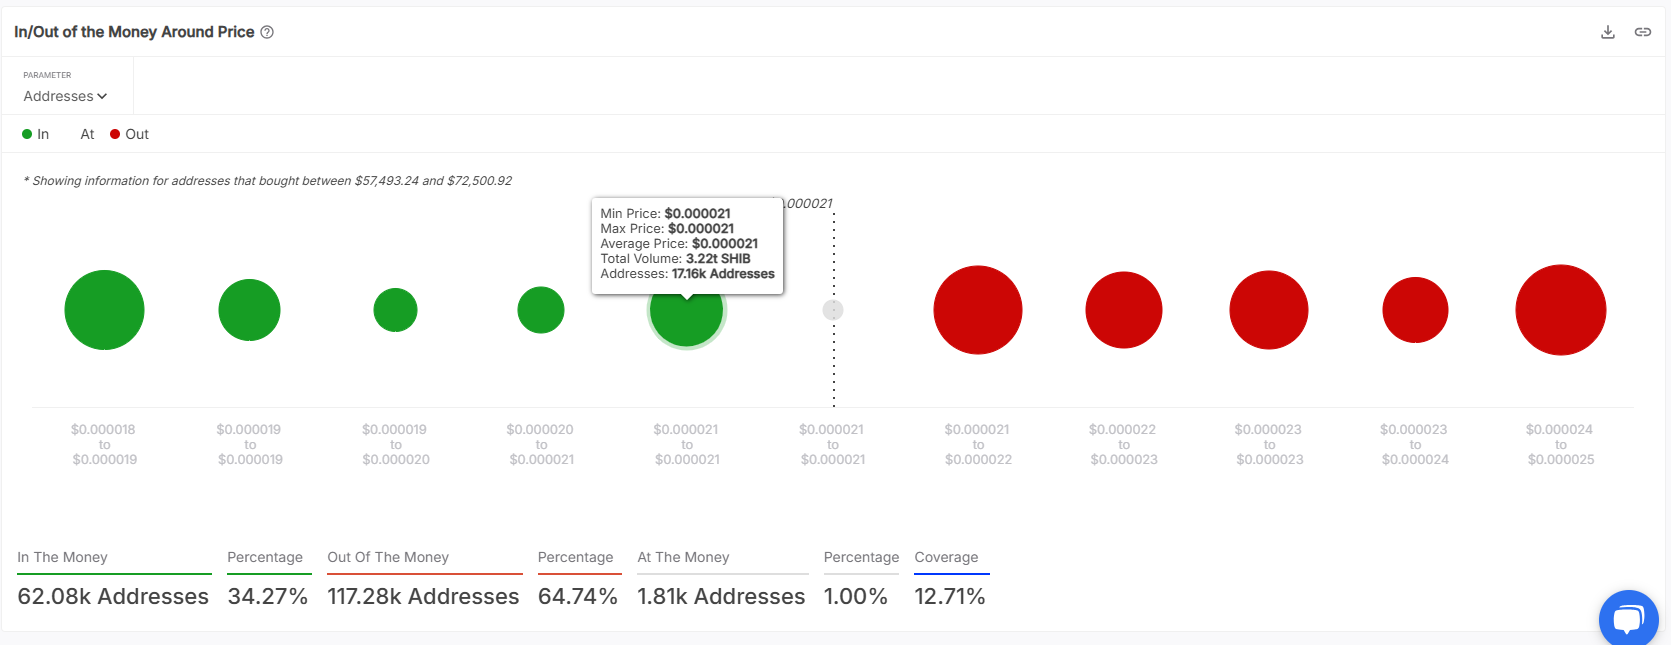
SHIB IOMAP chart. Source: IntoTheBlock
According to Coinglass’s OI-Weighted Funding Rate data, the number of traders betting that the price of SHIB will rally is higher than that anticipating a price fall.
This index is based on the yields of futures contracts, which are weighted by their open interest rates. Generally, a positive rate (longs pay shorts) indicates bullish sentiment, while negative numbers (shorts pay longs) indicate bearishness.
In the case of SHIB, this metric stands at 0.0103%, reflecting a positive rate. This scenario often signifies bullish sentiment in the market, suggesting potential upward pressure on Shiba Inu’s price.
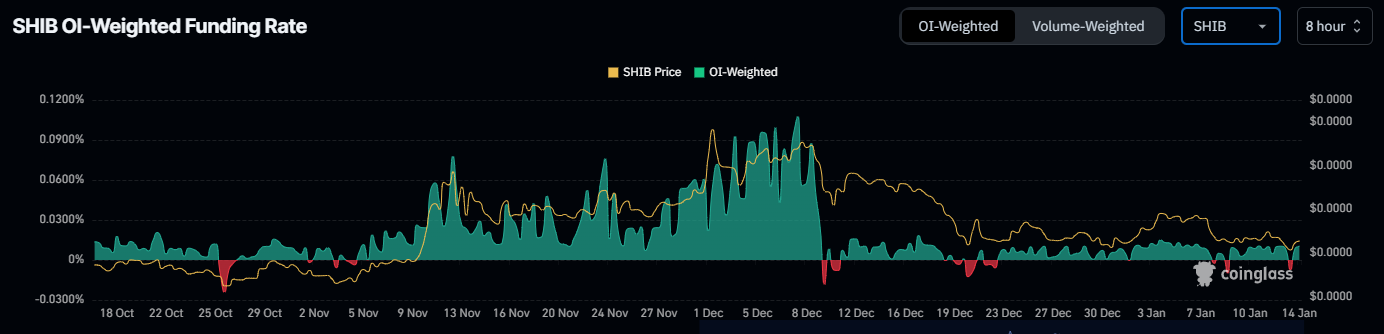
SHIB OI-Weighted Funding Rate chart. Source: Coinglass
Even though on-chain metrics support the bullish outlook, if Shiba Inu closes below $0.000019 on the daily chart, the bullish thesis would be invalidated by creating a lower low. This development could see SHIB’s price decline by an additional 15% to retest its November 3 low of $0.000016.
Author

Manish Chhetri
FXStreet
Manish Chhetri is a crypto specialist with over four years of experience in the cryptocurrency industry.


