Shiba Inu price fears 50% drop if bulls fail to hold critical support in control of SHIB fate
- Shiba Inu price is approaching a critical line of defense that might determine the fate of the token.
- SHIB is at risk of a steep decline, given the prevailing bearish bias of the chart pattern it has presented.
- The canine-themed token could expect a 50% decline if it fails to hold $0.00000550.
Shiba Inu price is nearing critical support that would dictate the fate for SHIB. Despite the dog-themed token’s attempt to break above crucial resistance, the coin failed to hold onto support, opening up the risk of a steep decline.
Shiba Inu price appears to be headed for a plunge
Shiba Inu price has been building a descending triangle pattern on the 12-hour chart, presenting a bearish outlook. Although SHIB has been able to slice above the hypotenuse of the chart pattern on June 29, the canine-themed token appears to be headed for a sharp drop.
SHIB broke below both the declining trend line as well as the horizontal base of the triangle on July 19, painting a bearish bias for Shiba Inu price.
The measured move of the prevailing chart pattern suggests that Shiba Inu price could drop 50%. This is calculated by measuring the height of the triangle and subtracting it from the base of the triangle, projecting a steep decline to $0.00000322.
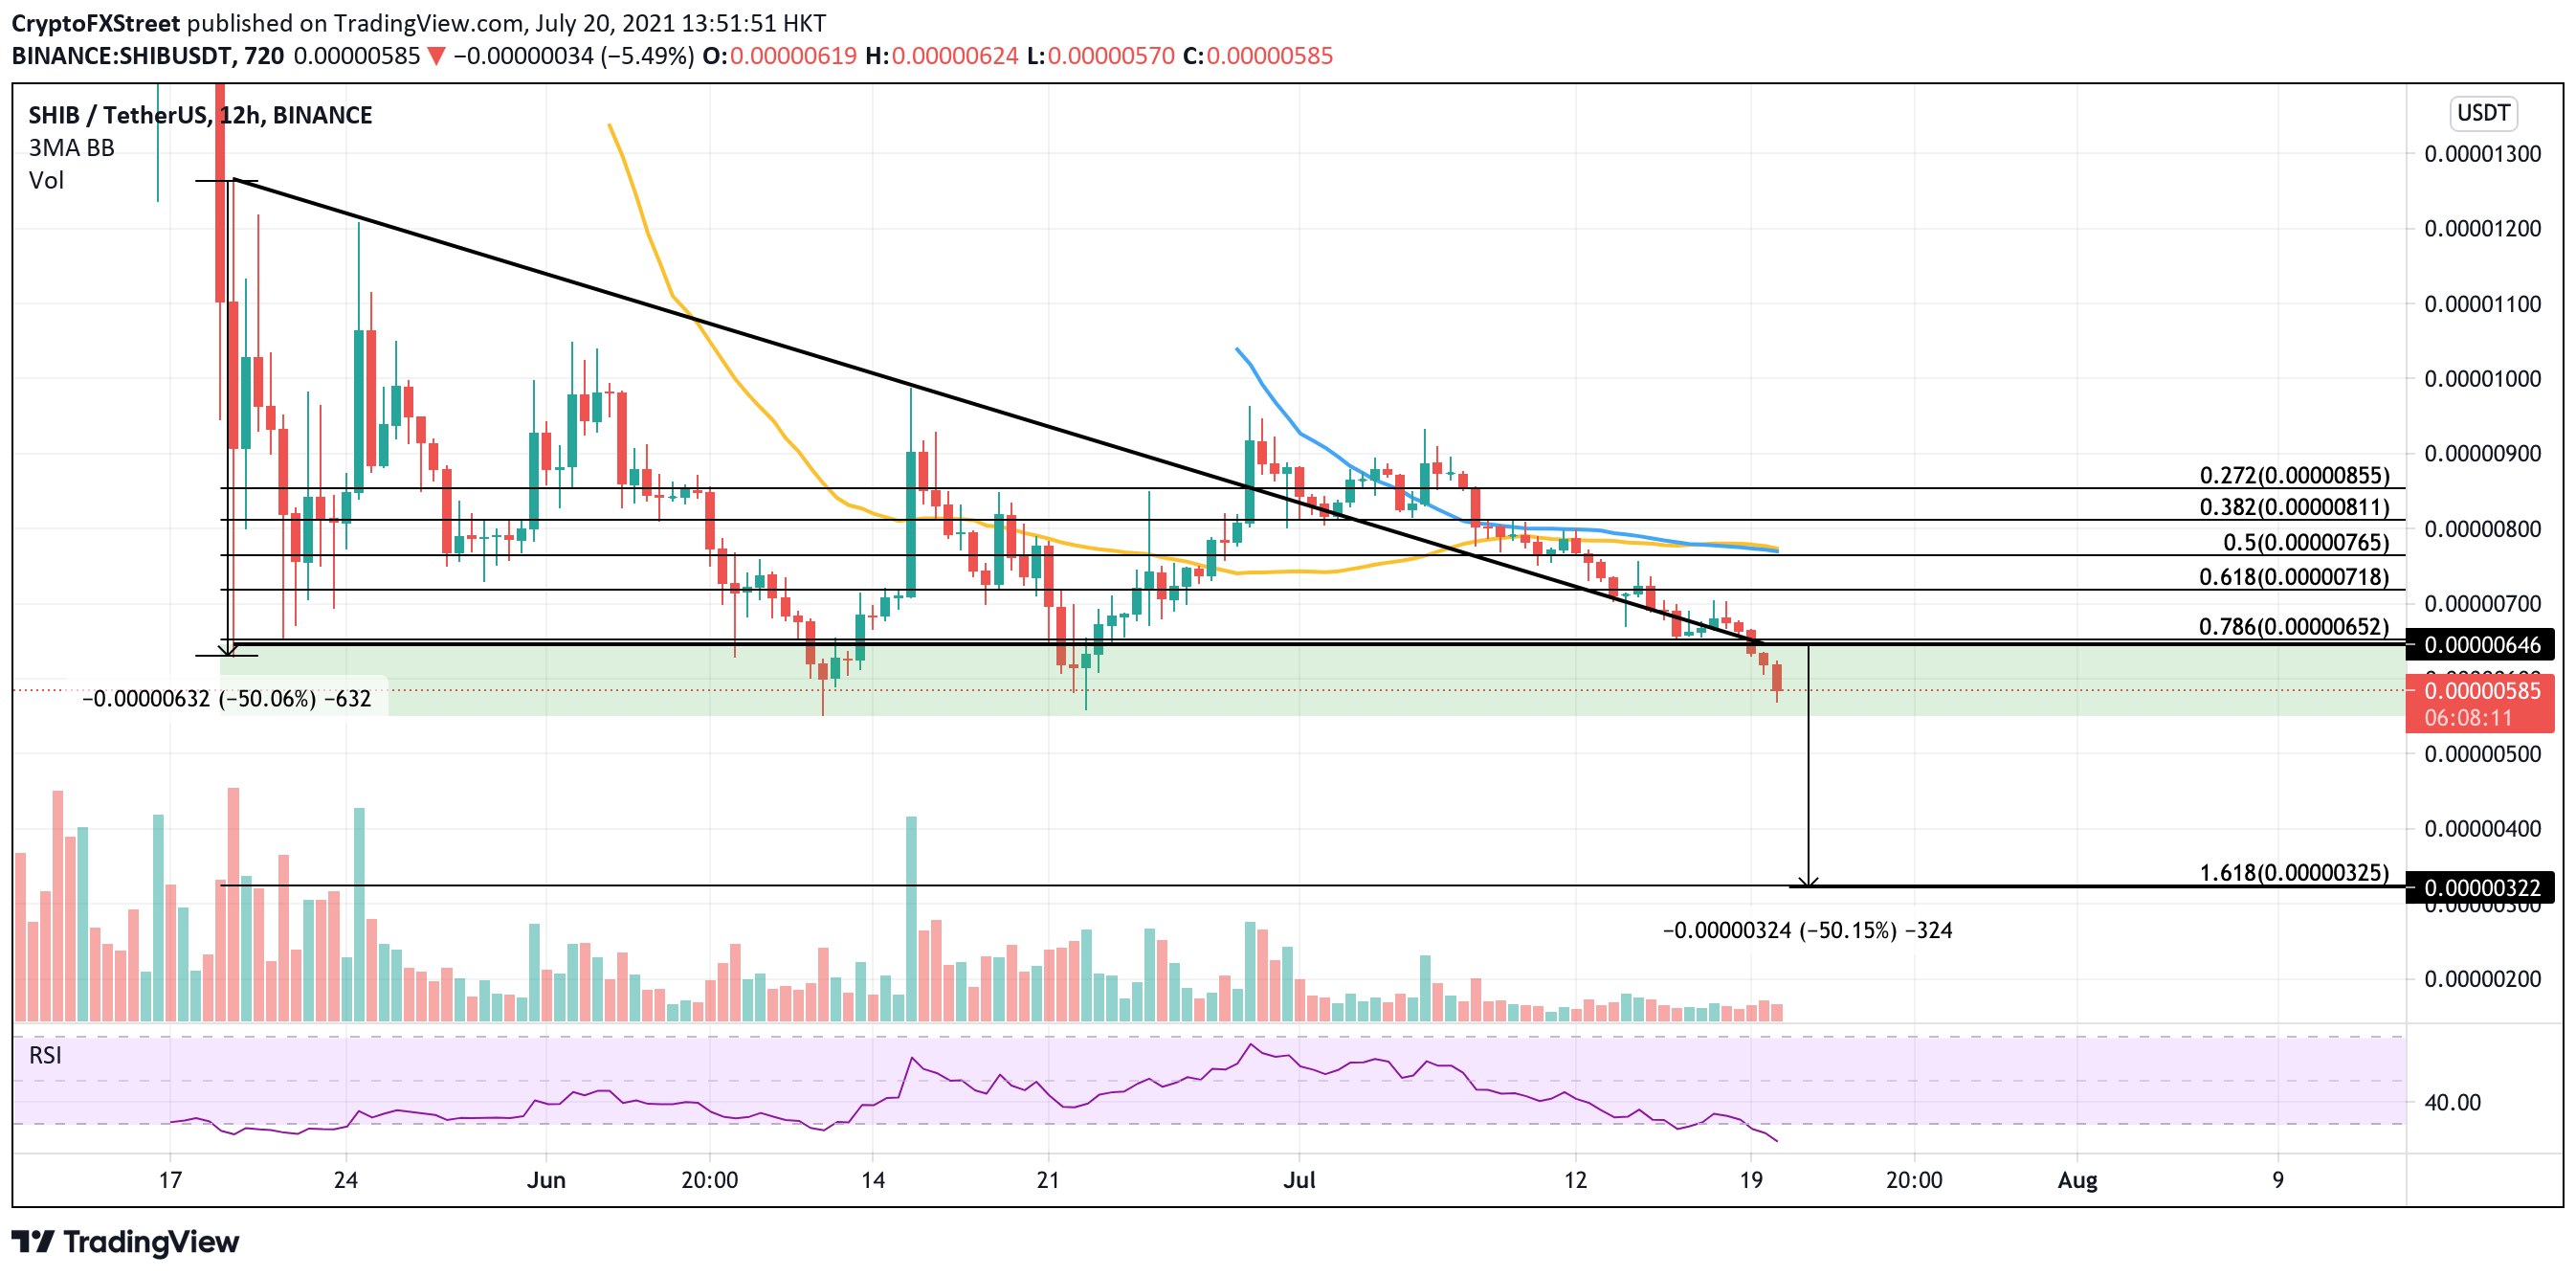
SHIB/USDT 12-hour chart
The 161.8% Fibonacci retracement level further adds credence to the bearish bias, which coincides with the aforementioned bearish target.
While this massive fall to the downside remains a possibility for Shiba Inu price, only if SHIB plunges below the lower boundary of the demand zone at $0.00000550 due to a spike in selling pressure should this target be on the radar.
Currently, the June 12 low at $0.00000550 acts as meaningful support for Shiba Inu price. Should the bulls manage to incentivize SHIB for a recovery, the dog-themed token could bounce off this level and tag the horizontal trend line corresponding to the 78.6% Fibonacci retracement level at $0.00000652.
Further bullish momentum could see Shiba Inu attempt to tag the 61.8% Fibonacci retracement level, before pushing further toward the 50% Fibonacci retracement that coincides with the 50 and 100 twelve-hour Simple Moving Average (SMA). Investors should note that this area acts as stiff resistance for SHIB, and targets beyond this level would not be anticipated in the short term.
Author

Sarah Tran
Independent Analyst
Sarah has closely followed the growth of blockchain technology and its adoption since 2016.


