• Shiba Inu price has collapsed into a descending parallel channel as it continues to lack decisiveness and commitment. 
  • While technical indicators are suggesting a trend reversal, the upside potential for SHIB is restricted.
  • Possible bullish targets for Shiba Inu seem to be out of reach until it breaks above critical levels of resistance. 

Shiba Inu price has been sealed in a declining consolidation pattern that started on July 6. A technical indicator has presented a buy signal at a crucial level of support, pointing to a potential short-term recovery.

Shiba Inu price struggles to thrive on buy signal

Shiba Inu price broke out of a declining resistance trend line on June 29 that has imprisoned SHIB for 41 days. 

Shiba Inu quickly traded this trend line into support, however, SHIB lost this area of defense on July 13 when a red candlestick closed under this level. 

On the 12-hour chart, Shiba Inu price has been trapped within descending parallel channel, consistently forming lower lows and lower highs. 

While the prevailing direction of this chart pattern suggests that SHIB price could continue to move lower, the Momentum Reversal Indicator flashed a buy signal. Adding credence to the recovery thesis is the Relative Strength Index, which showed that Shiba Inu was oversold on July 16.

Shiba Inu price

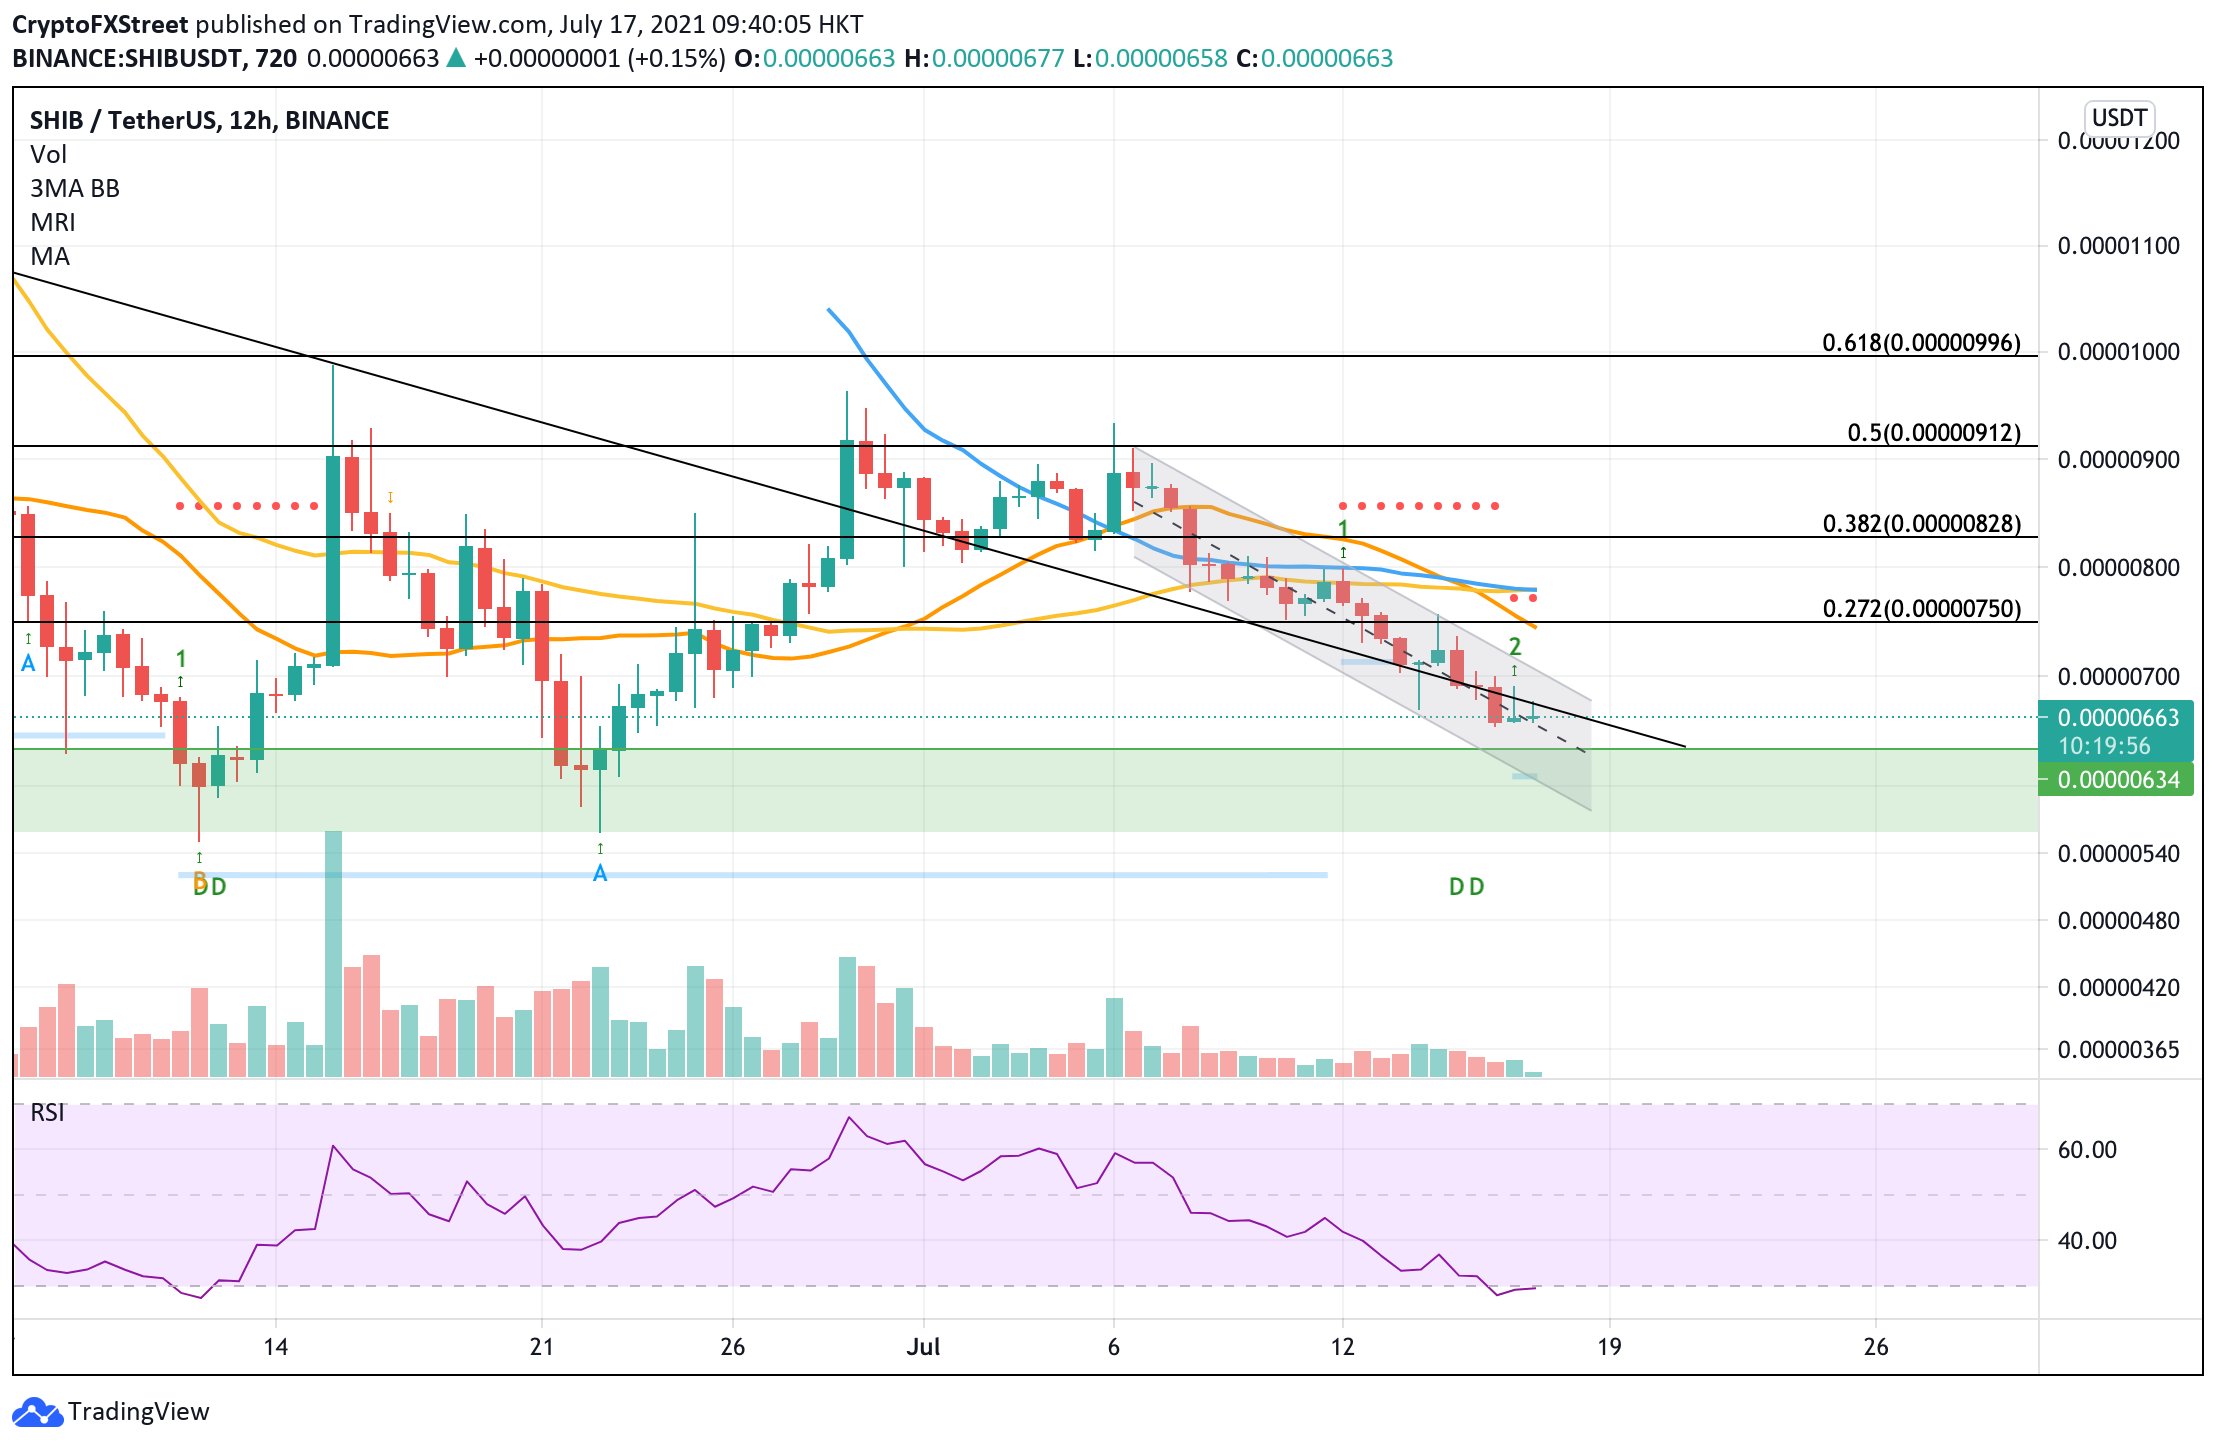
SHIB/USDT 12-hour chart

However, an aim at recovery could present limited upside potential for Shiba Inu price, as it faces multiple obstacles ahead. SHIB must climb above the aforementioned declining resistance trend line to be able to reverse the period of underperformance.

Should Shiba Inu witness accelerated interest, SHIB could aim at the next target at the 27.2% Fibonacci extension level, coinciding with the 20 twelve-hour Simple Moving Average (SMA) at $0.00000750. 

Investors should note that bigger aspirations beyond this level are unlikely in the near term, as Shiba Inu price is met with a resistance line given by the MRI, corresponding to the 50 and 100 twelve-hour SMAs at $0.00000776.

On the contrary, if SHIB bears continue to take control over the market, Shiba Inu price could slip below the middle boundary of the chart pattern, which acts as the first line of defense. 

Should Shiba Inu price witness a spike in selling pressure, SHIB could find itself falling into the demand zone that ranges from $0.00000560 to $0.00000634 once again.


Note: All information on this page is subject to change. The use of this website constitutes acceptance of our user agreement. Please read our privacy policy and legal disclaimer. Opinions expressed at FXstreet.com are those of the individual authors and do not necessarily represent the opinion of FXstreet.com or its management. Risk Disclosure: Trading foreign exchange on margin carries a high level of risk, and may not be suitable for all investors. The high degree of leverage can work against you as well as for you. Before deciding to invest in foreign exchange you should carefully consider your investment objectives, level of experience, and risk appetite. The possibility exists that you could sustain a loss of some or all of your initial investment and therefore you should not invest money that you cannot afford to lose. You should be aware of all the risks associated with foreign exchange trading, and seek advice from an independent financial advisor if you have any doubts.

Recommended content


Recommended Content

Editors’ Picks

Is Ethereum's comeback real?

Is Ethereum's comeback real?

Ethereum price hovers above $2,500 on Friday after soaring nearly 100% since early April's bottom. The ETH Pectra upgrade has boosted over 11,000 EIP-7702 authorizations in a week, indicating healthy uptake by wallets and dApps. The growing stablecoin usage and tokenization, Layer 2 institutionalization and ETH short unwind support the price rally.

Bitcoin Weekly Forecast: BTC stabilizes near $103,000 amid trade optimism, rising institutional demand

Bitcoin Weekly Forecast: BTC stabilizes near $103,000 amid trade optimism, rising institutional demand

Bitcoin price stabilizes around $103,000 on Friday after facing multiple rejections at the key $105,000 resistance level throughout the week. Risk-on sentiment prevails, driven by global trade deals, strong corporate accumulation, and spot ETF inflows.

EOS price climbs as sentiment improves following $3 million purchase by President Trump's World Liberty Financial

EOS price climbs as sentiment improves following $3 million purchase by President Trump's World Liberty Financial

EOS price rebounds from short-term support at $0.75, boosting bullish sentiment amid broader market consolidation. President Donald Trump's World Liberty Financial purchases $3 million worth of EOS at an average price of $0.82.

FTX creditors set to receive over $5 billion in recovery plan payout handled by Kraken and BitGo

FTX creditors set to receive over $5 billion in recovery plan payout handled by Kraken and BitGo

Defunct crypto exchange FTX will distribute $5 billion to holders of allowed claims starting May 30. Creditors with completed pre-distribution requirements will receive between 54% and 120% of their original claims.

Bitcoin: BTC stabilizes near $103,000 amid trade optimism, rising institutional demand

Bitcoin: BTC stabilizes near $103,000 amid trade optimism, rising institutional demand

Bitcoin (BTC) price stabilizes at around $103,000 when writing on Friday, after facing multiple rejections at the key $105,000 resistance level throughout the week.

The Best brokers to trade EUR/USD

The Best brokers to trade EUR/USD

SPONSORED Discover the top brokers for trading EUR/USD in 2025. Our list features brokers with competitive spreads, fast execution, and powerful platforms. Whether you're a beginner or an expert, find the right partner to navigate the dynamic Forex market.

BTC

ETH

XRP