Shiba Inu price continues balancing act, as SHIB nears a dramatic move
- Shiba Inu price continues to traffic in a descending parallel channel, finding support along the midline.
- SHIB price range continues to contract, pressing Bollinger Bands and signaling an immediate move.
- May 19 of $0.00000607 maintains support as indecision dominates price action.
Shiba Inu price has failed to resolve the depressingly tight price action or the descending parallel channel, testing SHIB investor patience and the durability of the May 19 low support. The building contraction in price, verified by the tightening of the Bollinger Bands, indicates that the digital token is preparing for a sharp move that may resolve the channel pattern and establish a new, definitive trend.
Shiba Inu price churn wearing on investor’s patience
Shiba Inu price closed last week with a loss of -0.79%, marking the lowest weekly close for SHIB since the beginning of May and leaving July with a -29.14% loss. The lack of commitment and emotion for the newer cryptocurrency reflects the interests of investors for established digital assets and the paralyzing lack of FOMO that directed many cryptocurrencies, including SHIB, earlier in the year.
Due to the paralyzation of Shiba Inu price action, the Bollinger Bands on the daily chart have compressed tightly around SHIB, communicating that the meme token is approaching a sizeable move.
The obvious inflection points for the Shiba Inu price are the May 19 low of $0.00000607 on the downside and the 50-day simple moving average (SMA) at $0.00000717 on the upside. The importance of the May 19 low grows with every session as SHIB shifts sideways above $0.00000607, playing a balancing act, as it avoids registering a daily close below.
A daily Shiba Inu price close below the May 19 low, the descending parallel channel’s midline at $0.00000558, and the June 12 low of $0.00000550 would immediately boost the probabilities that Shiba Inu price will pursue a test of the channel’s lower line, now at $0.00000325. A fall of that magnitude would carry a -40.91% loss for stubborn SHIB investors.
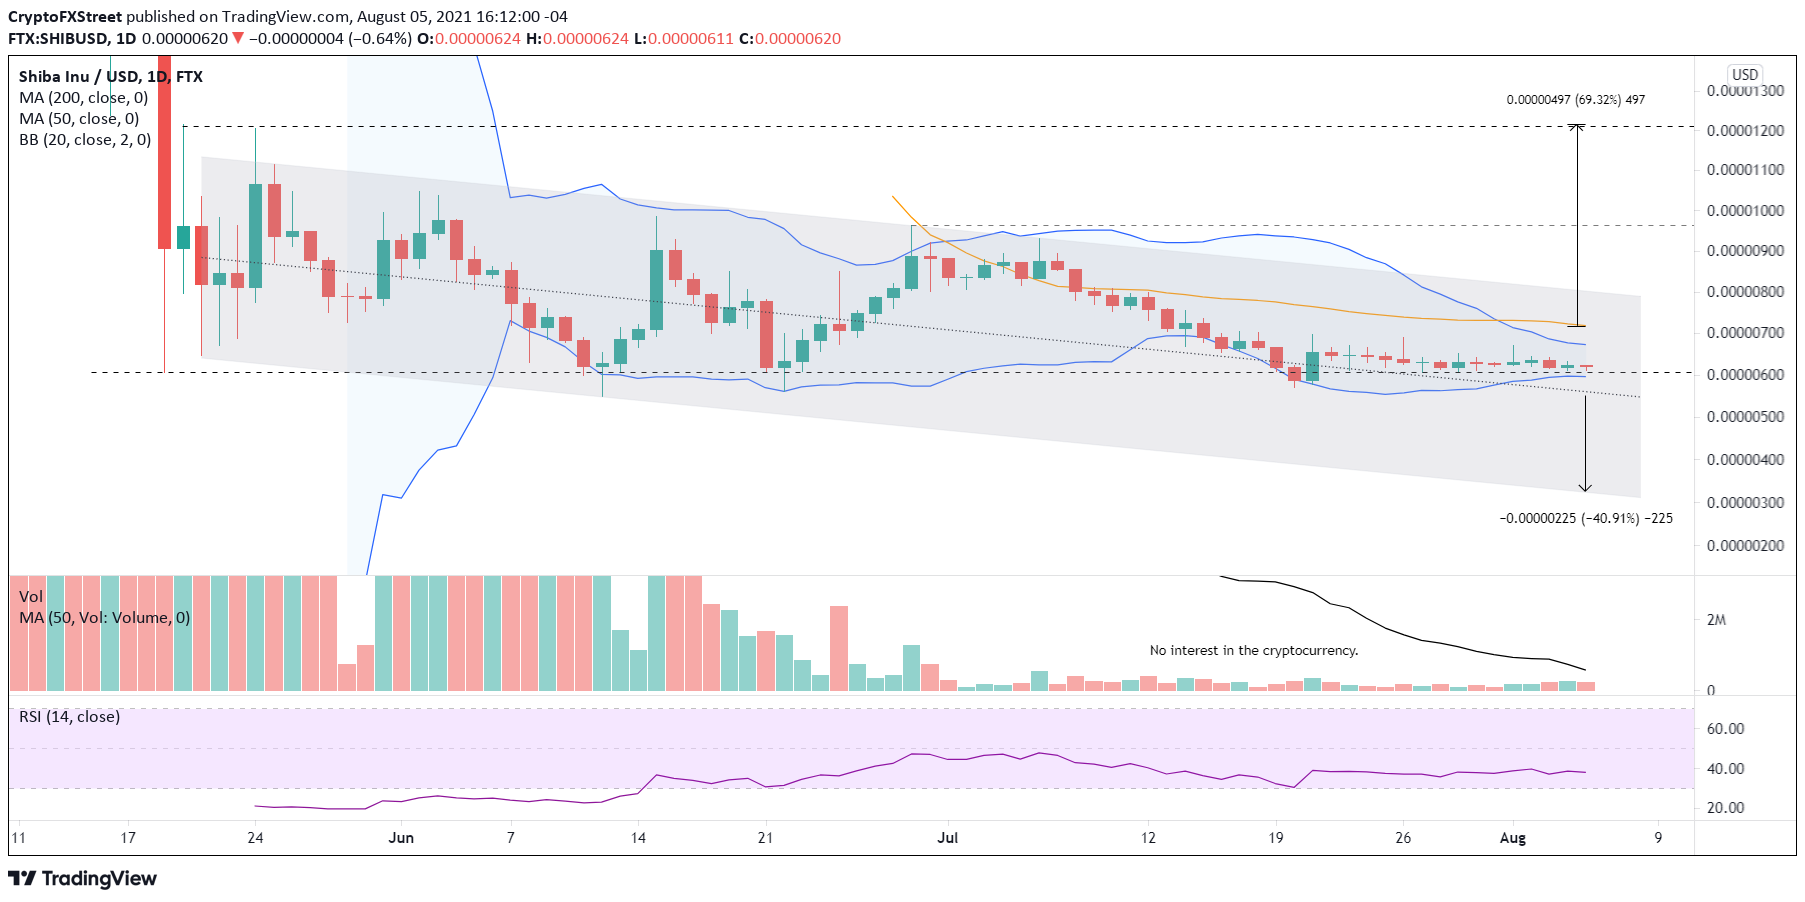
SHIB/USD daily chart
Conversely, a daily close above the declining 50-day SMA at $0.00000717 would introduce new possibilities for Shiba Inu price, including a breakout from the upper line of the descending parallel channel at $0.00000797 and a march to the May 24 and May 20 highs at $0.00001214 and $0.00001204, respectively. A rally to $0.000001214 would reward SHIB investors with a 69.32% gain from the 50-day SMA.
In the current structure, Shiba Inu price is not actionable below the 50-day SMA. After a sustained period of price churn, SHIB must clarify its directional intentions with a conclusive close above or below the vital price levels stated above.
Here, FXStreet's analysts evaluate where Shib could be heading next as it seems bound to advance further.
Author

Sheldon McIntyre, CMT
Independent Analyst
Sheldon has 24 years of investment experience holding various positions in companies based in the United States and Chile. His core competencies include BRIC and G-10 equity markets, swing and position trading and technical analysis.


