Shiba Inu Price Forecast: SHIB has only one side, and it is to the downside
- Shiba Inu price cannot shake the magnet effect of the May 19 low of $0.00000607 and the descending parallel channel midline.
- SHIB is up just over 6% over the last ten days, showing no commitment or emotion that has been widespread in the cryptocurrency complex.
- eToro announces the listing of Shiba Inu to their multi-asset investment platform, and the digital token climbs only 2%.
Shiba Inu price has not capitalized on the momentum in the cryptocurrency complex, the presence of credible support or the eToro announcement yesterday. It is a frustrating scenario for SHIB investors. It indicates a strong reluctance to traffic in the newer, higher-risk cryptocurrencies, despite evidence of a renewed risk-on spirit in the cryptocurrency complex over the ten days. As a result, the risk remains tilted to the downside indefinitely.
Shiba Inu price still has not found a catalyst, raising doubts for the meme token
On July 21, Shiba Inu price was presented with an opportunity as it released from a minor descending parallel channel, captured the May 19 low of $0.00000607 and the larger descending parallel channel’s midline. Moreover, it was accompanied by a strong bid in the cryptocurrency complex offering a tailwind for SHIB.
However, Shiba Inu price shook off the brief impulsiveness and has been drifting along the support designed by the May 19 low and the larger channel’s midline, leaving several doji candlestick patterns. The important support level has not inspired a bid, even on the eToro news, and the indecision represented by the doji candlestick patterns portends that the sideways price action is a pause in the SHIB decline that began earlier in July.
The obvious inflection point on the upside for Shiba Inu price is the 50-day simple moving average (SMA) at $0.00000730, which has been hovering above SHIB since it appeared in late June. A daily close above the moving average would clear the meme token for a sprint to the upper line of the larger descending parallel channel around $0.00000828, generating a 13.5% gain from the moving average.
A daily close above the larger channel’s upper line introduces a new scenario for Shiba Inu price where it is not restricted by a tactically important moving average or the boundaries of a pattern. Instead, it can push to the trigger the double bottom pattern created by the lows of June 22 and July 20 at $0.000000962 and explore the potential to advance to the May 24 high of $0.00001204 or the May 20 high of $0.00001214, representing a 66% profit from the 50-day SMA.
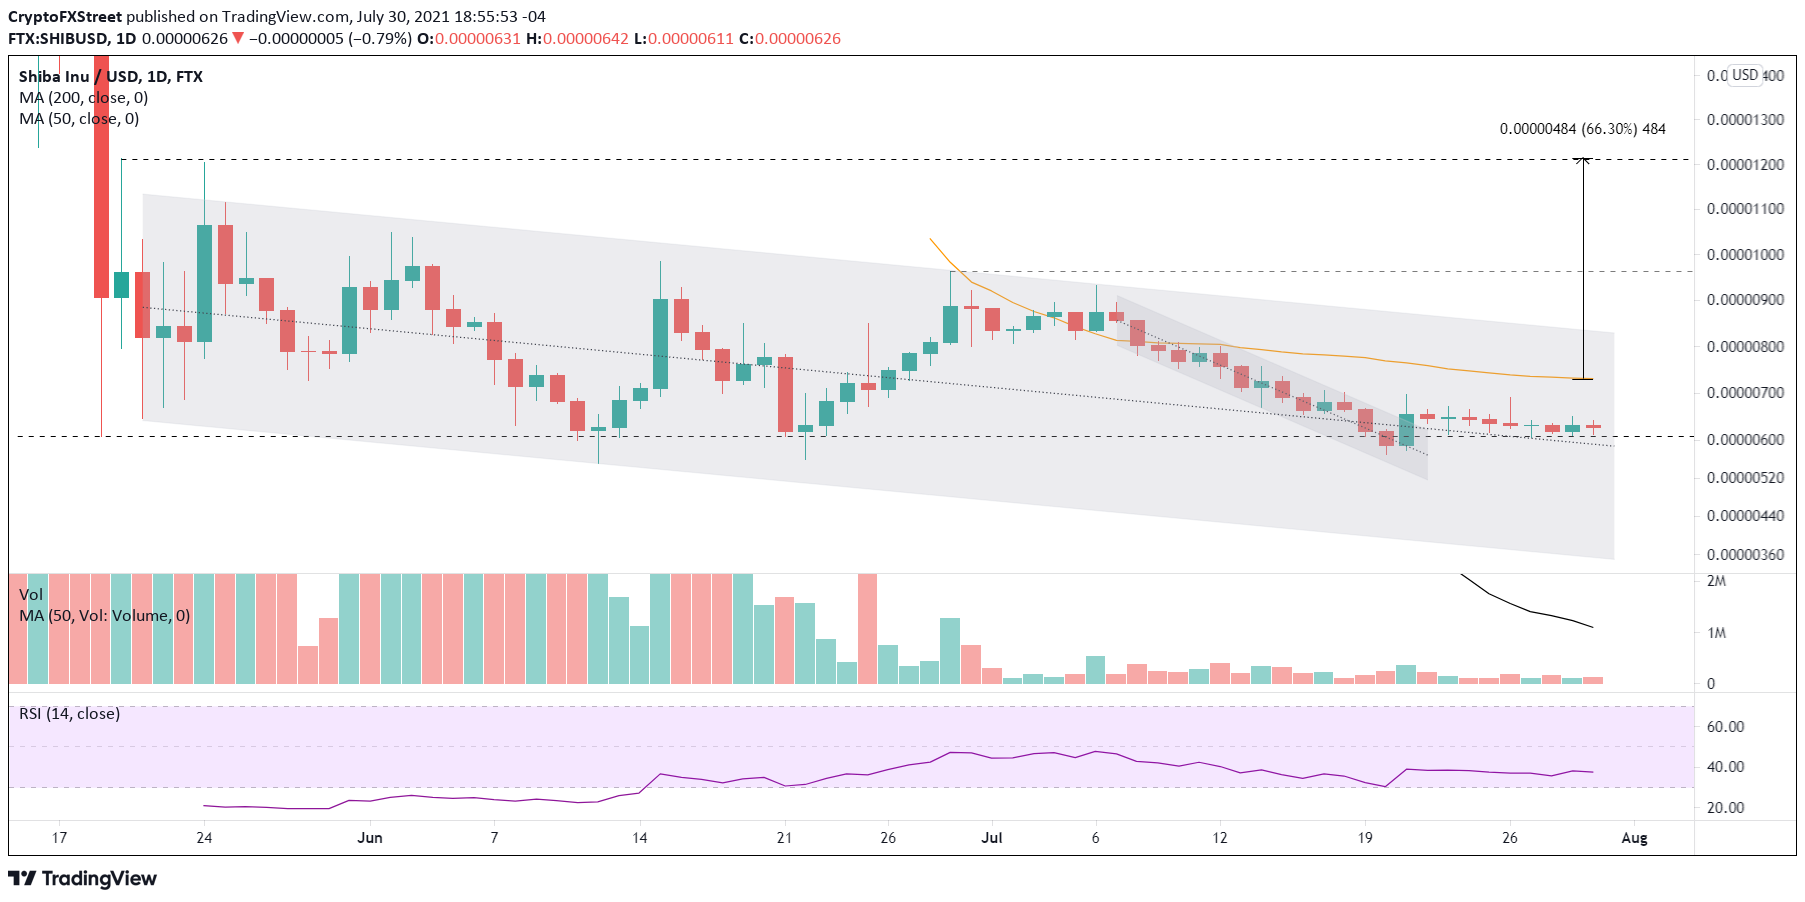
SHIB/USD daily chart
Alternatively, a daily close below the May 19 low of $0.00000607 and the larger descending parallel channel’s midline at $0.00000587 would immediately raise the probability that Shiba Inu price will test the channel’s lower line, now at $0.00000355, carrying a loss of 40%. The June 12 low of $0.00000550 may offer mild support, but it is not a level to buy against.
As long as Shiba Inu price changes hands below the 50-day SMA at $0.00000730, there is no rush to operate in SHIB as risk is definitely tilted to the downside.
After a sustained period of no price movement, SHIB needs to clarify its directional intentions with a definitive close above or below a vital price level outlined above. Until then, focus on the cryptocurrencies that demonstrate relative strength and are in a timely position for purchase.
Here, FXStreet's analysts evaluate where SHIB could be heading next as it remains consolidating.
Author

Sheldon McIntyre, CMT
Independent Analyst
Sheldon has 24 years of investment experience holding various positions in companies based in the United States and Chile. His core competencies include BRIC and G-10 equity markets, swing and position trading and technical analysis.


