Shiba Inu price may need a miracle as SHIB nears critical support
- Shiba Inu price remains locked in the right shoulder of an inverse head-and-shoulders pattern that began in late May.
- The 30% decline from June 29 has been crushing for the SHIB bulls, but the 6-hour Relative Strength (RSI) just registered an oversold reading.
- The May 19 low of $0.00000607 is now coming into view and must provide support for the pattern to survive.
Shiba Inu price outlook of better outcomes has been neutralized by the slow drift lower from June 29, raising the odds that the ongoing development of an inverse head-and-shoulders pattern may fail. However, the emergence of an oversold condition on the 6-hour RSI does create possible bullish scenarios, renewing the spirit of the SHIB bottoming pattern.
Shiba Inu price aspirations are slowly being extinguished
In a period void of FOMO, Shiba Inu price has struggled to move beyond brief moments of price strength and into a sustainable SHIB rally that would ultimately erase the 85% decline that materialized over nine days in May.
The emergence of the inverse head-and-shoulders pattern over the last 52 trading days, after numerous false breakouts from minor bases, has provoked a renewed interest in SHIB due to the increased clarity of the formation and the substantial projected measured move of over 80%.
However, the bearish tilt of the broader cryptocurrency market has been undermining the completion of the right shoulder and exposed Shiba Inu price to a break of the June lows, thereby voiding the opportunity.
The announcement on July 13 of an oversold condition on the 6-hour RSI is the first concrete sign that the drift lower may be nearing an end. The oversold condition did trigger a minor rebound in price, but the weight of the cryptocurrency complex has left Shiba Inu price vulnerable to test the oversold low. Of course, the oversold condition could still arrest the weakness and drive SHIB permanently higher, offering one bullish scenario for the rookie cryptocurrency and a new stage in the completion of the inverse head-and-shoulders pattern.
Alternatively, Shiba Inu price could undercut the July 13 low of $0.00000669, but the 6-hour RSI does not print a new low, creating a bullish momentum divergence that could provide the basis for a rebound towards the sturdy resistance defined by the 200 six-hour simple moving average (SMA) at $0.00000785, and ideally to the neckline, currently at $0.00000917.
It is important to note that the last time the 6-hour RSI was this oversold, Shiba Inu price launched an 80% rally in mid-June. Moreover, the rebound did begin slowly, like now, before taking on an impulsive character.
The critical resistance is the 200 six-hour SMA in each scenario, which aligns with the 50-day SMA. A daily close above $0.00000785 would confirm a final low for the right shoulder and a continuation of the rally to the neckline.
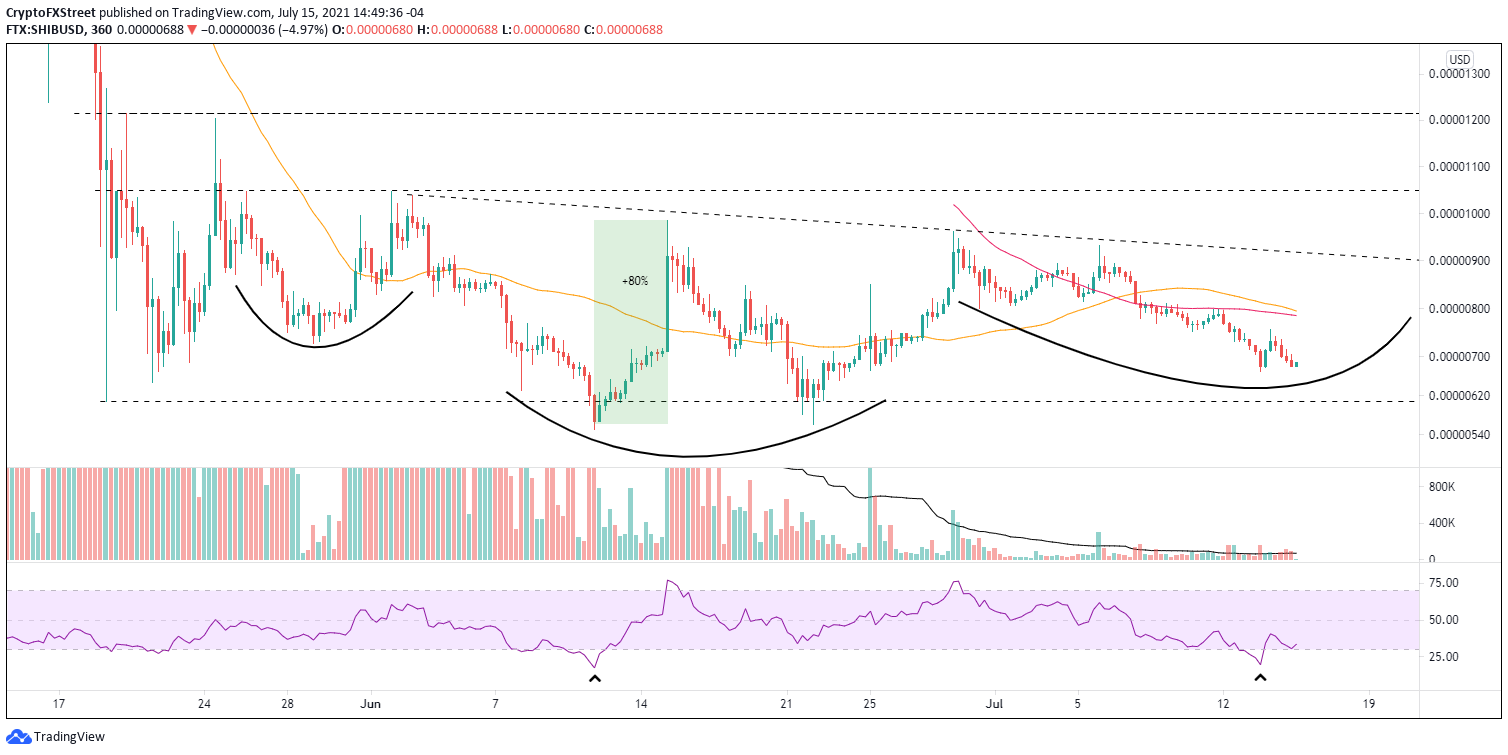
SHIB/USD 6-hour chart
Fundamental to the enduring bullish outlook is Shiba Inu price holding the May 19 low of $0.00000607 on a daily closing basis. A failure at that level introduces a new SHIB projection and proposes more one-off price jumps moving forward. An ideal scenario for swing traders but not for investors targeting sustainable advances with triple-digit results.
For now, the bullish SHIB forecast remains active as the oversold condition on the 6-hour chart does marginally revitalize the spirit of the bottoming pattern. Nevertheless, the constant grind lower does reveal a lack of commitment and emotion fundamental to overcoming broader cryptocurrency weakness, putting Shiba Inu price at risk of shattering the May 19 low and abandoning another failed pattern. Hence, the altcoin may need a miracle to avoid a bearish outcome.
Author

Sheldon McIntyre, CMT
Independent Analyst
Sheldon has 24 years of investment experience holding various positions in companies based in the United States and Chile. His core competencies include BRIC and G-10 equity markets, swing and position trading and technical analysis.


