SHIB Price Analysis: Shiba Inu bulls drop ball, risking full rally unwind
- Shiba Inu price collapsed in a volatile session on Wednesday after hitting 22% gains intraday.
- SHIB saw bulls quickly cashing in, triggering a big fade into the US closing bell.
- The move on Wednesday offered room for bears to enter and run price action further down in the coming days.

Shiba Inu (SHIB) price action made a staggering jump of over 22% intraday between the low and the high point of Wednesday. Unfortunately, in a video webinar you can find on the FXStreet YouTube channel, warnings were issued on a repetition of Saturday, October 29 of last year, where price action jumped but deflated near the closing bell and saw more than half of its intraday profits evaporate. With plenty of bulls jumping on the breakouts on Wednesday, bears saw a window of opportunity to get back short, and pressure could start to build again to the downside.
Shiba Inu price needs to cool down by 20%
Shiba Inu price was riding the wave of risk-on sentiment in a volatile trading session on Wednesday. All asset classes were trading in very stretched volatility, and traders were slightly clueless about which direction to take. The volatility came with the Bank of Japan and European Central Bank member Villeroy delivering opposite views and dampening the current stance of global markets toward the approach of both central banks. With markets positioned the wrong way completely, it became clear that the Goldilocks drive from the beginning of this year is starting to clash with the harsh and hawkish comments from central bankers across the globe.
SHIB pierced through the monthly R2, the R3 and above the green ascending trend line that was well-respected back in November. Unfortunately, as a failed pudding, price action sank lower as minutes passed toward the US closing bell. Many bulls will have bought into the price action on the aforementioned breaks and are facing heavy losses this morning.
Meanwhile, bears are comfortably in the green, having the Relative Strength Index (RSI) in their favor for more downside moves as the price action is too overbought with a correction very much needed soon. Expect to see very choppy trading around the R2 pivot level, but once the 200-day Simple Moving Average (SMA) as the floor breaks down, the road is open to drop back below $0.00001000 with $0.00000900 as the best candidate to find support. At that level, bearing 20% losses, the 55-day SMA and the monthly pivot are present to catch any downward moves.
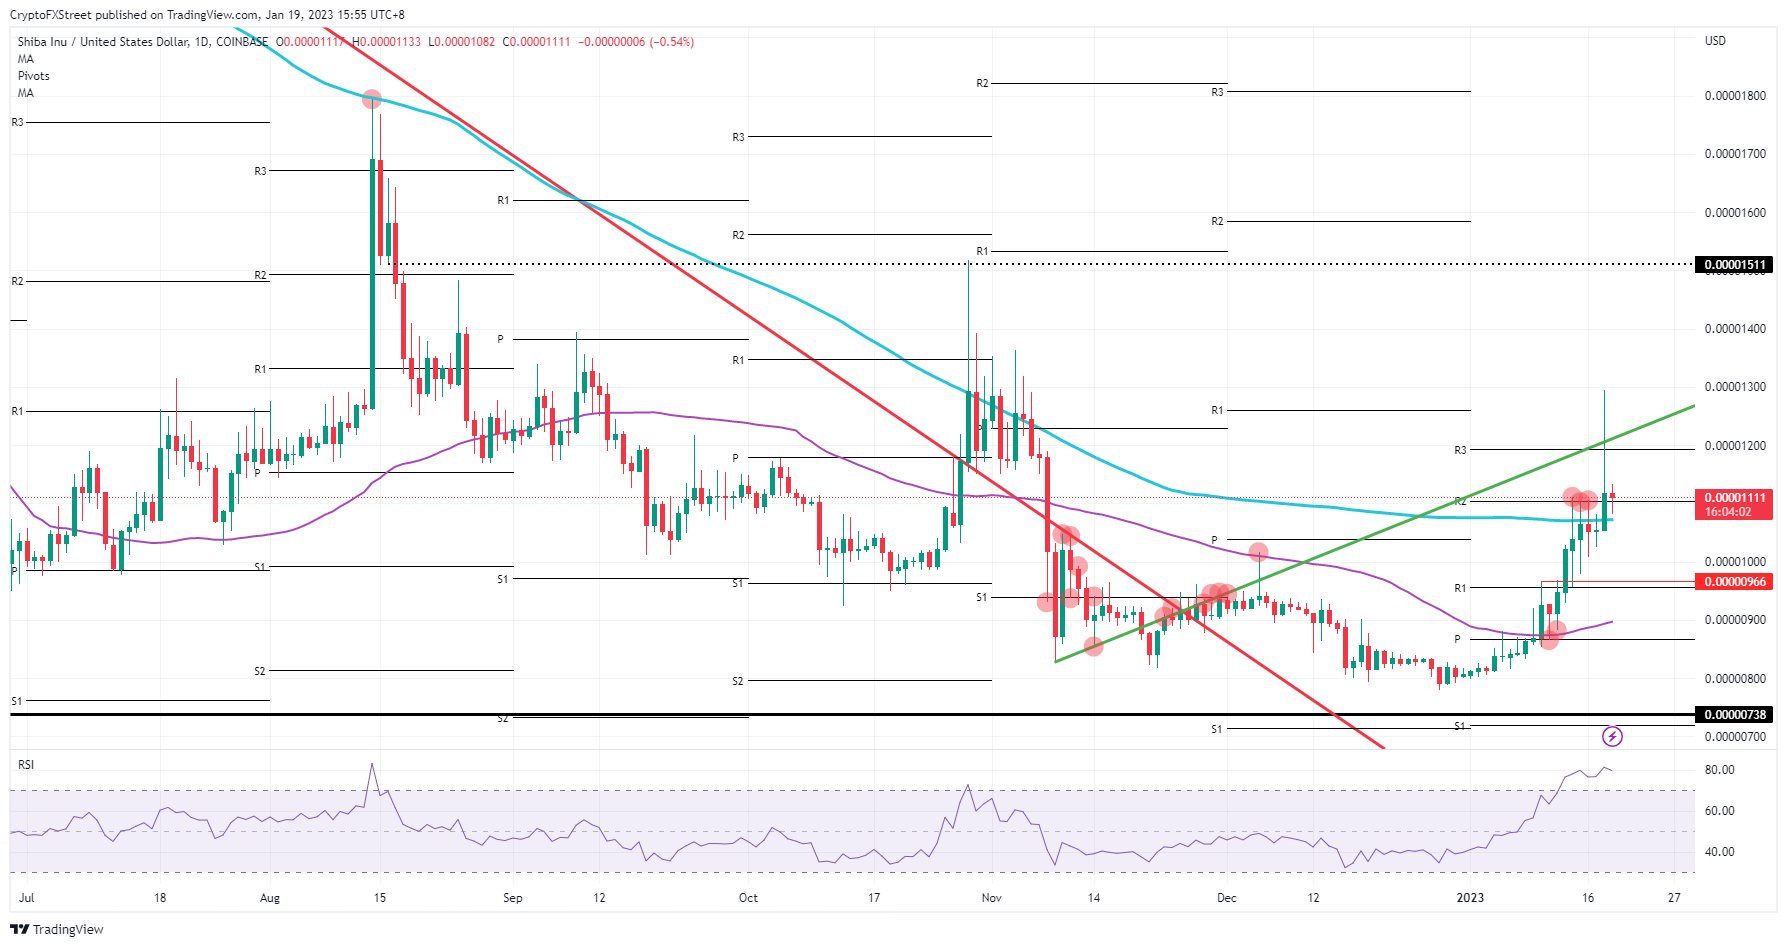
SHIB/USD daily chart
The biggest central bank of them all, the US Federal Reserve, has come a long way in the past few months with its hikes. Should the Fed communicate a smaller increment of hikes with only 25 basis points per meeting, markets would re-believe in the Goldilocks scenario. The Fed would succeed in triggering a soft landing for the economy with the job market not seeing its unemployment army grow into the millions and economic indicators ready to tie back up with growth numbers once the central bank starts to pause and cut rates again. On the back of that, Shiba Inu price would gradually rally back again and see sustainable investor inflow with price action consolidating above $0.00001200, with $0.00001511 as a target soon.
Author

Filip Lagaart
FXStreet
Filip Lagaart is a former sales/trader with over 15 years of financial markets expertise under its belt.



