- Ethereum whales continue accumulating SHIB in vast quantities, and Shiba Inu ranks as most traded by top 100 whales.
- The largest Ethereum whales hold $635.6 million worth of Shiba Inu tokens in their wallets.
- Shiba Inu price could rebound from the 38.2% Fibonacci retracement level and make a comeback to $0.00001239.
Ethereum whales continued their accumulation of Shiba Inu, the second-largest meme coin in the ecosystem. Shiba Inu (SHIB) ranks in the top ten most traded cryptocurrencies among 100 largest whales on the Ethereum blockchain. This could fuel a bullish narrative for SHIB and drive the meme coin’s price higher.
Also read: Here’s what Bitcoin, Ethereum prices need for an explosive rally following US PPI release
Ethereum whales hunt massive gains in Shiba Inu
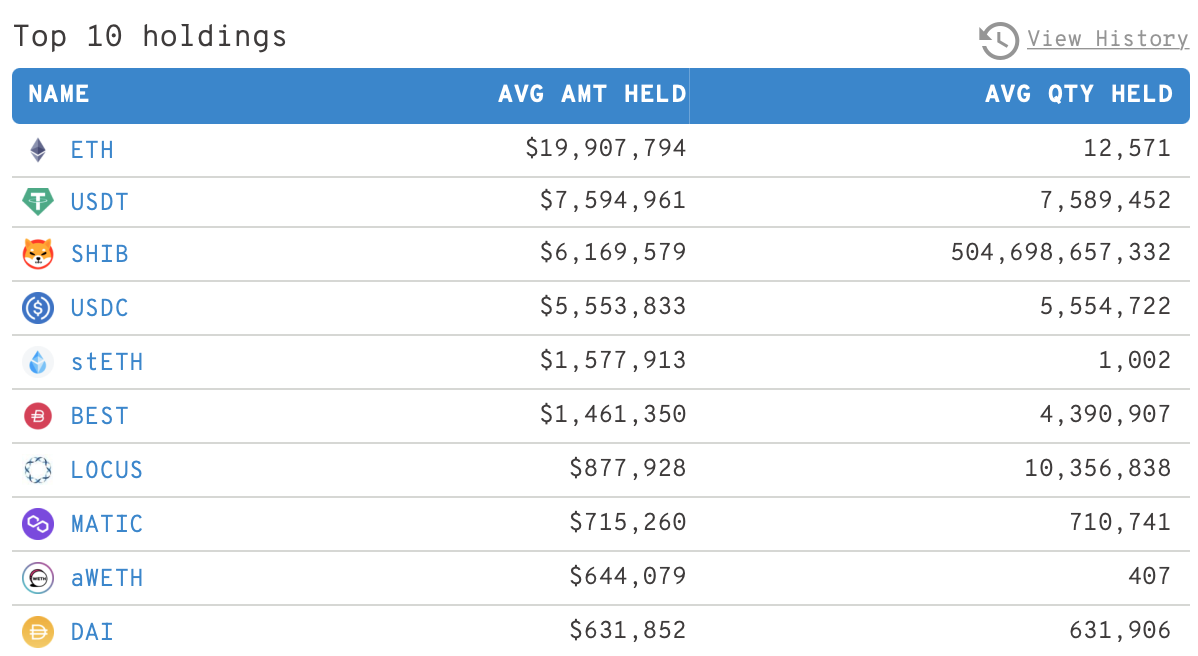
Shiba Inu ranks in the top 10 traded tokens by the Ethereum network’s 100 largest wallet investors. Shiba Inu is the third largest token held by Ethereum whales, after ETH and the stablecoin Tether (USDT).
The 100 largest whales on the Ethereum network hold an average of $6.16 million worth of SHIB, in 504.69 billion SHIB tokens.
Ethereum network’s 100 largest ETH whales
Based on data from crypto aggregator Whalestats, Shiba Inu is the token with the biggest position by US Dollar value. Whale activity recently hit a peak, on January 17. A spike in whale activity is usually considered bearish for the asset’s price, however, Shiba Inu is at a critical level and experts predict a recovery in the Dogecoin-killer.
Shiba Inu price prepares for recovery after recent decline
Shiba Inu, the second-largest meme coin in the crypto ecosystem, broke out of its long-term downtrend on December 29. This marked the end of the Month-on-Month downtrend for the Dogecoin-killer.
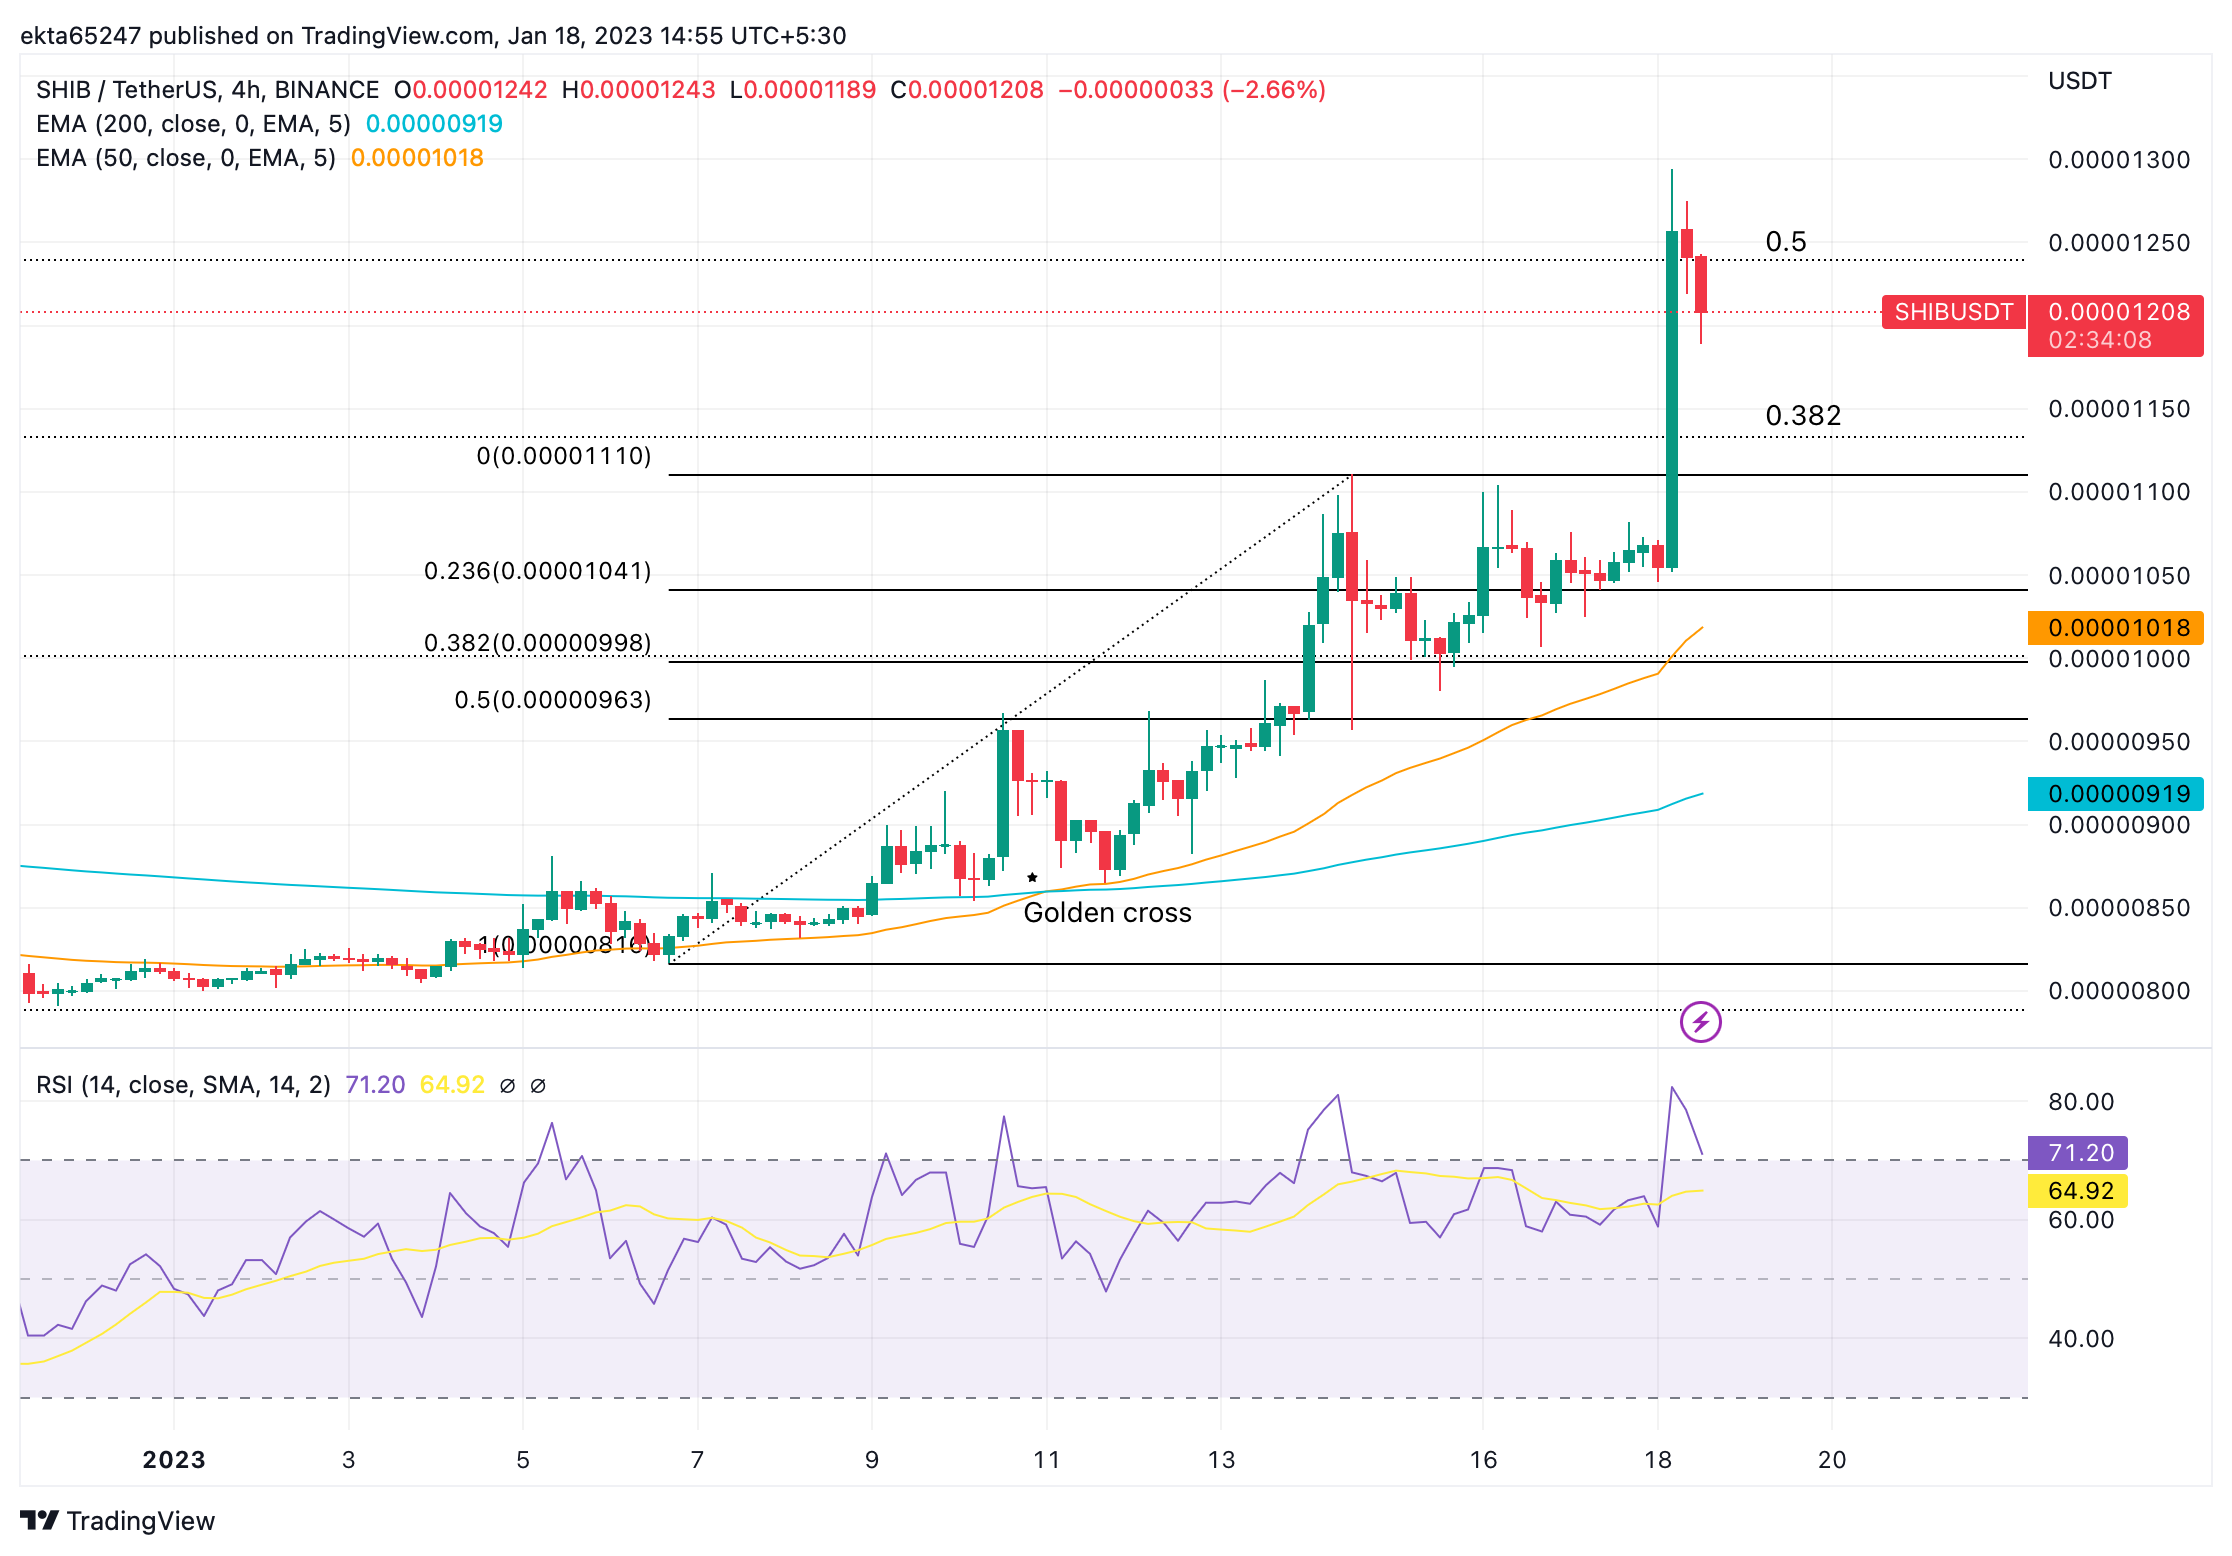
SHIB failed to cross resistance at the 50% Fibonacci retracement level in its uptrend the 1D price chart. On the 4H price chart, Shiba Inu nosedived from the 50% Fibonacci retracement level.
SHIB/USDT price chart
Relative Strength Index (RSI), a momentum indicator reads 71.20, meaning SHIB is in the oversold territory and traders are advised not to open any fresh longs. If it falls below the 70 level it will be a signal to sell and might indicate the start of a pullback. Shiba Inu’s 50-day Exponential Moving Average (EMA) crossed above the 200-day EMA, in a bullish “Golden Cross” on the price chart on January 10, 2023.
With the recent decline in whale activity on the Ethereum blockchain, Shiba Inu could rebound from the drop in its price and hit the $0.00001250 level.
Information on these pages contains forward-looking statements that involve risks and uncertainties. Markets and instruments profiled on this page are for informational purposes only and should not in any way come across as a recommendation to buy or sell in these assets. You should do your own thorough research before making any investment decisions. FXStreet does not in any way guarantee that this information is free from mistakes, errors, or material misstatements. It also does not guarantee that this information is of a timely nature. Investing in Open Markets involves a great deal of risk, including the loss of all or a portion of your investment, as well as emotional distress. All risks, losses and costs associated with investing, including total loss of principal, are your responsibility. The views and opinions expressed in this article are those of the authors and do not necessarily reflect the official policy or position of FXStreet nor its advertisers. The author will not be held responsible for information that is found at the end of links posted on this page.
If not otherwise explicitly mentioned in the body of the article, at the time of writing, the author has no position in any stock mentioned in this article and no business relationship with any company mentioned. The author has not received compensation for writing this article, other than from FXStreet.
FXStreet and the author do not provide personalized recommendations. The author makes no representations as to the accuracy, completeness, or suitability of this information. FXStreet and the author will not be liable for any errors, omissions or any losses, injuries or damages arising from this information and its display or use. Errors and omissions excepted.
The author and FXStreet are not registered investment advisors and nothing in this article is intended to be investment advice.
Recommended Content
Editors’ Picks
Ripple's move above this key level could trigger nearly 50% rally for XRP
Ripple has overcome a critical resistance level and flipped into a support floor on the weekly time frame. This development happened while XRP tightly consolidated for roughly 250 days. Investors can expect XRP to kickstart a massive rally.
Optimism price outlook with nearly $90 million worth of OP tokens flooding markets on Friday
Optimism volatility has shrunk in the ours leading to the network’s cliff unlock. It joins the likes of dYdX and Sui, which have similar events on their calendars. As token unlocks are often considered bearish catalysts, investors should brace for a reaction after the event.
Top 3 Price Prediction Bitcoin, Ethereum, Ripple: Retail watches from the sidelines with a bias for shorts
Bitcoin could clear $73,777 peak as BTC bulls resurface. Ethereum might fall 10% before next leg up as ETH RSI teases with sell signal. XRP could lose $0.6000 threshold as Ripple bulls fail to show up.
Jito price could hit $6 as JTO coils up inside this bullish pattern
Jito price action shows a potential cup and handle formation. Based on theoretical measurement rules, a successful breakout could yield a 56% rally to $6.0. A breakdown of the $3.86 support level would create a lower low for JTO and invalidate the bullish thesis.
Bitcoin: BTC may have recovered, but is it out of the woods?
Bitcoin’s (BTC) upward momentum has shown a significant decline for the past two weeks or so. This development led to a bearish signal on the weekly and an uncertain outlook on the monthly.