- Since December, sandbox has been trying to break the downtrend.
- As bulls attempt to break through, expect some profits to be booked as some targets lie nearby.
- Once above $4.72, expect $5.00 and $6.00 to be the following targets in the relief rally.
Sandbox (SAND) price action is surfing on a wave of relief this morning as tensions between Russia, and the West start to ease on positive news. With that, investors have been falling over each other to get back into cryptocurrencies, and Sandbox price is set to break the longer-term red descending trendline, and downtrend since December last year. Some low-hanging fruit will be targeted in the breakthrough and could provide enough incentive for bulls to book partial profits and go for the ultimate goal of $6.00, holding 47% of gains.
Sandbox bulls are in for 47% gains in the relief rally
Sandbox price action is again hammering on the red descending trend line that originates from December last year and has been dictating the downtrend ever since. The renewed push comes from tailwinds that emerged overnight on some positive news around de-escalation in the situation between Russia and Ukraine. As the scene is set for a solid relief rally, expect to see some excellent returns, beginning with some nice profits nearby as a good start.
SAND bulls will have their eyes on $4.72 with the 55-day Simple Moving Average and an overall pivotal level falling in line around the same area. Although this level is not far from the red descending trendline, it will still return around 16% of gains intraday. Bulls will have a good incentive to book profits midway but stay in the trade with more considerable profits gained when the price rises towards $5.00 and $6.00 – the next targets in this week’s relief rally. The trade has an excellent risk-return ratio and is the most viable as we advance.
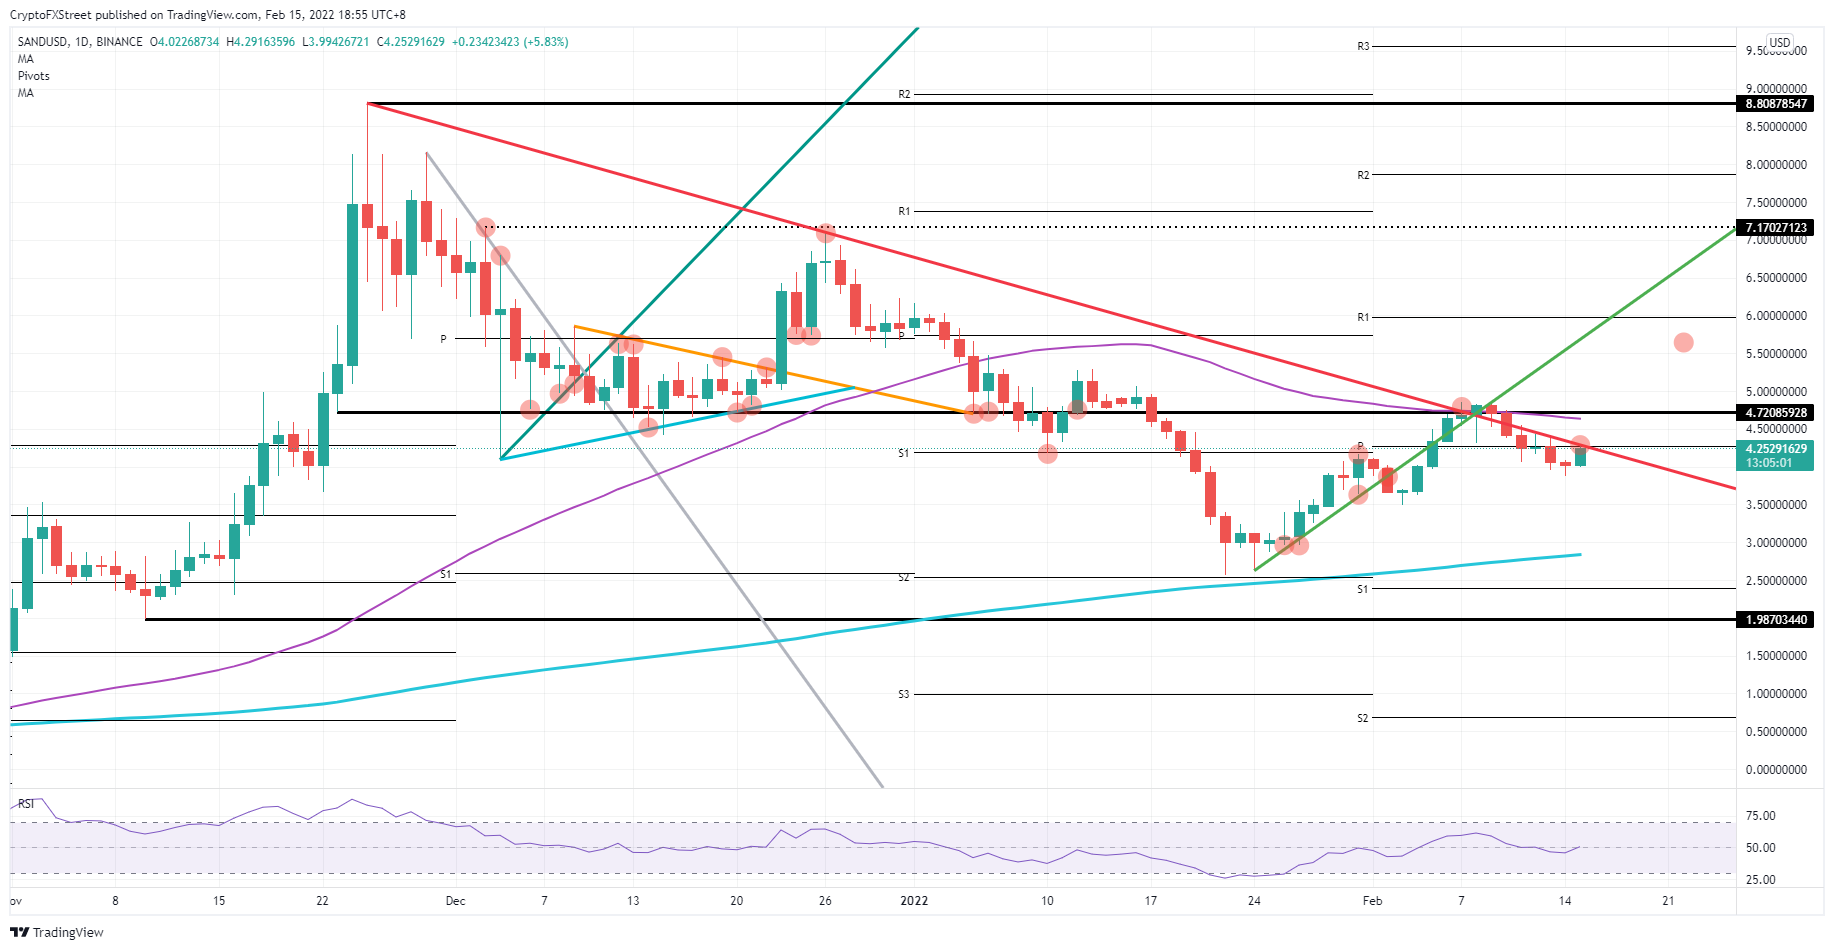
SAND/USD daily chart
Should German chancellor Scholz come out with some negative comments and ramp up the rhetoric of full-scale escalation of the tensions, expect a knee jerk reaction with a firm rejection or false break of the red descending trend line, trapping bulls and pushing them out of their positions as SAND price action collapses back towards $3.50. From there, another leg lower could follow towards $3.00, with the 200-day SMA coming in at around $2.85 and playing its part as a supportive element in the belief that a recovery is still possible. If the 200-day SMA is no match for the downward pressure, expect a break and further push towards $2.50 or $2.00.
Information on these pages contains forward-looking statements that involve risks and uncertainties. Markets and instruments profiled on this page are for informational purposes only and should not in any way come across as a recommendation to buy or sell in these assets. You should do your own thorough research before making any investment decisions. FXStreet does not in any way guarantee that this information is free from mistakes, errors, or material misstatements. It also does not guarantee that this information is of a timely nature. Investing in Open Markets involves a great deal of risk, including the loss of all or a portion of your investment, as well as emotional distress. All risks, losses and costs associated with investing, including total loss of principal, are your responsibility. The views and opinions expressed in this article are those of the authors and do not necessarily reflect the official policy or position of FXStreet nor its advertisers. The author will not be held responsible for information that is found at the end of links posted on this page.
If not otherwise explicitly mentioned in the body of the article, at the time of writing, the author has no position in any stock mentioned in this article and no business relationship with any company mentioned. The author has not received compensation for writing this article, other than from FXStreet.
FXStreet and the author do not provide personalized recommendations. The author makes no representations as to the accuracy, completeness, or suitability of this information. FXStreet and the author will not be liable for any errors, omissions or any losses, injuries or damages arising from this information and its display or use. Errors and omissions excepted.
The author and FXStreet are not registered investment advisors and nothing in this article is intended to be investment advice.
Recommended Content
Editors’ Picks

Bitcoin, Ethereum and XRP defend key support on sixth day of Israel-Iran war, what to expect
Bitcoin (BTC), Ethereum (ETH), and XRP are holding steady above key support levels. The top three cryptocurrencies have weathered the geopolitical tension and macroeconomic events of the past week.

Top Meme Coins Price Prediction: Dogecoin, Shiba Inu, Pepe set to extend losses
Top meme coins extend recent losses on Wednesday, with the segment’s market capitalization standing at $54.41 billion, a decline of over 20% in the past month. Dogecoin (DOGE) and Shiba Inu (SHIB) are down 3% so far this week.

Crypto Today: Bitcoin, Ethereum, XRP weather geopolitical tensions, risk-off sentiment ahead of Fed rate decision
The cryptocurrency market is broadly consolidating amid ongoing geopolitical tensions in the Middle East. Bitcoin (BTC) mirrors the lethargic sentiment, trading at around $104,572 at the time of writing on Wednesday.

Stellar and ApeCoin Price Prediction: XLM and APE at risk of further losses as technical weakness grows
Stellar price closes below its critical support at $0.2537, hinting at a correction ahead. ApeCoin touches the lower boundary of an ascending triangle formation, a breakdown would signal a downtrend.

Bitcoin: BTC could slump to $100K amid Trump-Musk tussle
Bitcoin (BTC) tumbled to a low of $101,095 on Friday amid volatility in the market. The effect of the tussle between United States (US) President Donald Trump and Tesla Chief Elon Musk negatively influenced the NASDAQ and Tesla's stock price on Thursday, although both are recovering on Friday.