Sandbox tests support at $4.25 before SAND test prior all-time highs
- Sandbox price hits its primary support structure must hold to pursue higher highs.
- The final resistance zone is just ahead near the $5 value area.
- Downside risks exist but are limited.

Sandbox price action has had a spectacular performance so far in February. From the February lows to the most recent swing high, SAND has gained nearly 40% and still remains 30% despite the selling pressure on Thursday from post US CPI jitters. The resulting price action has positioned Sandbox to test its primary support zone on the daily chart.
Sandbox price enters make-or-break zone near $4.25
Sandbox price is just above the critical $4.25 support zone, which contains the Tenkan-Sen and mid-line of the current bull flag, represented as a linear regression channel. The significance of this price level can’t be understated.
If bulls can keep Sandbox price above $4.25, the next hurdle is $5. $5 is not only a major psychological level, but it also contains the top of the linear regression channel/bull flag, the top of the Cloud (Senkou Span B), and the bottom of the Cloud (Senkou Span A). If SAND can break that resistance, then it will enter into an Ideal Bullish Ichimoku Breakout – a condition that would likely send SAND to new all-time highs.
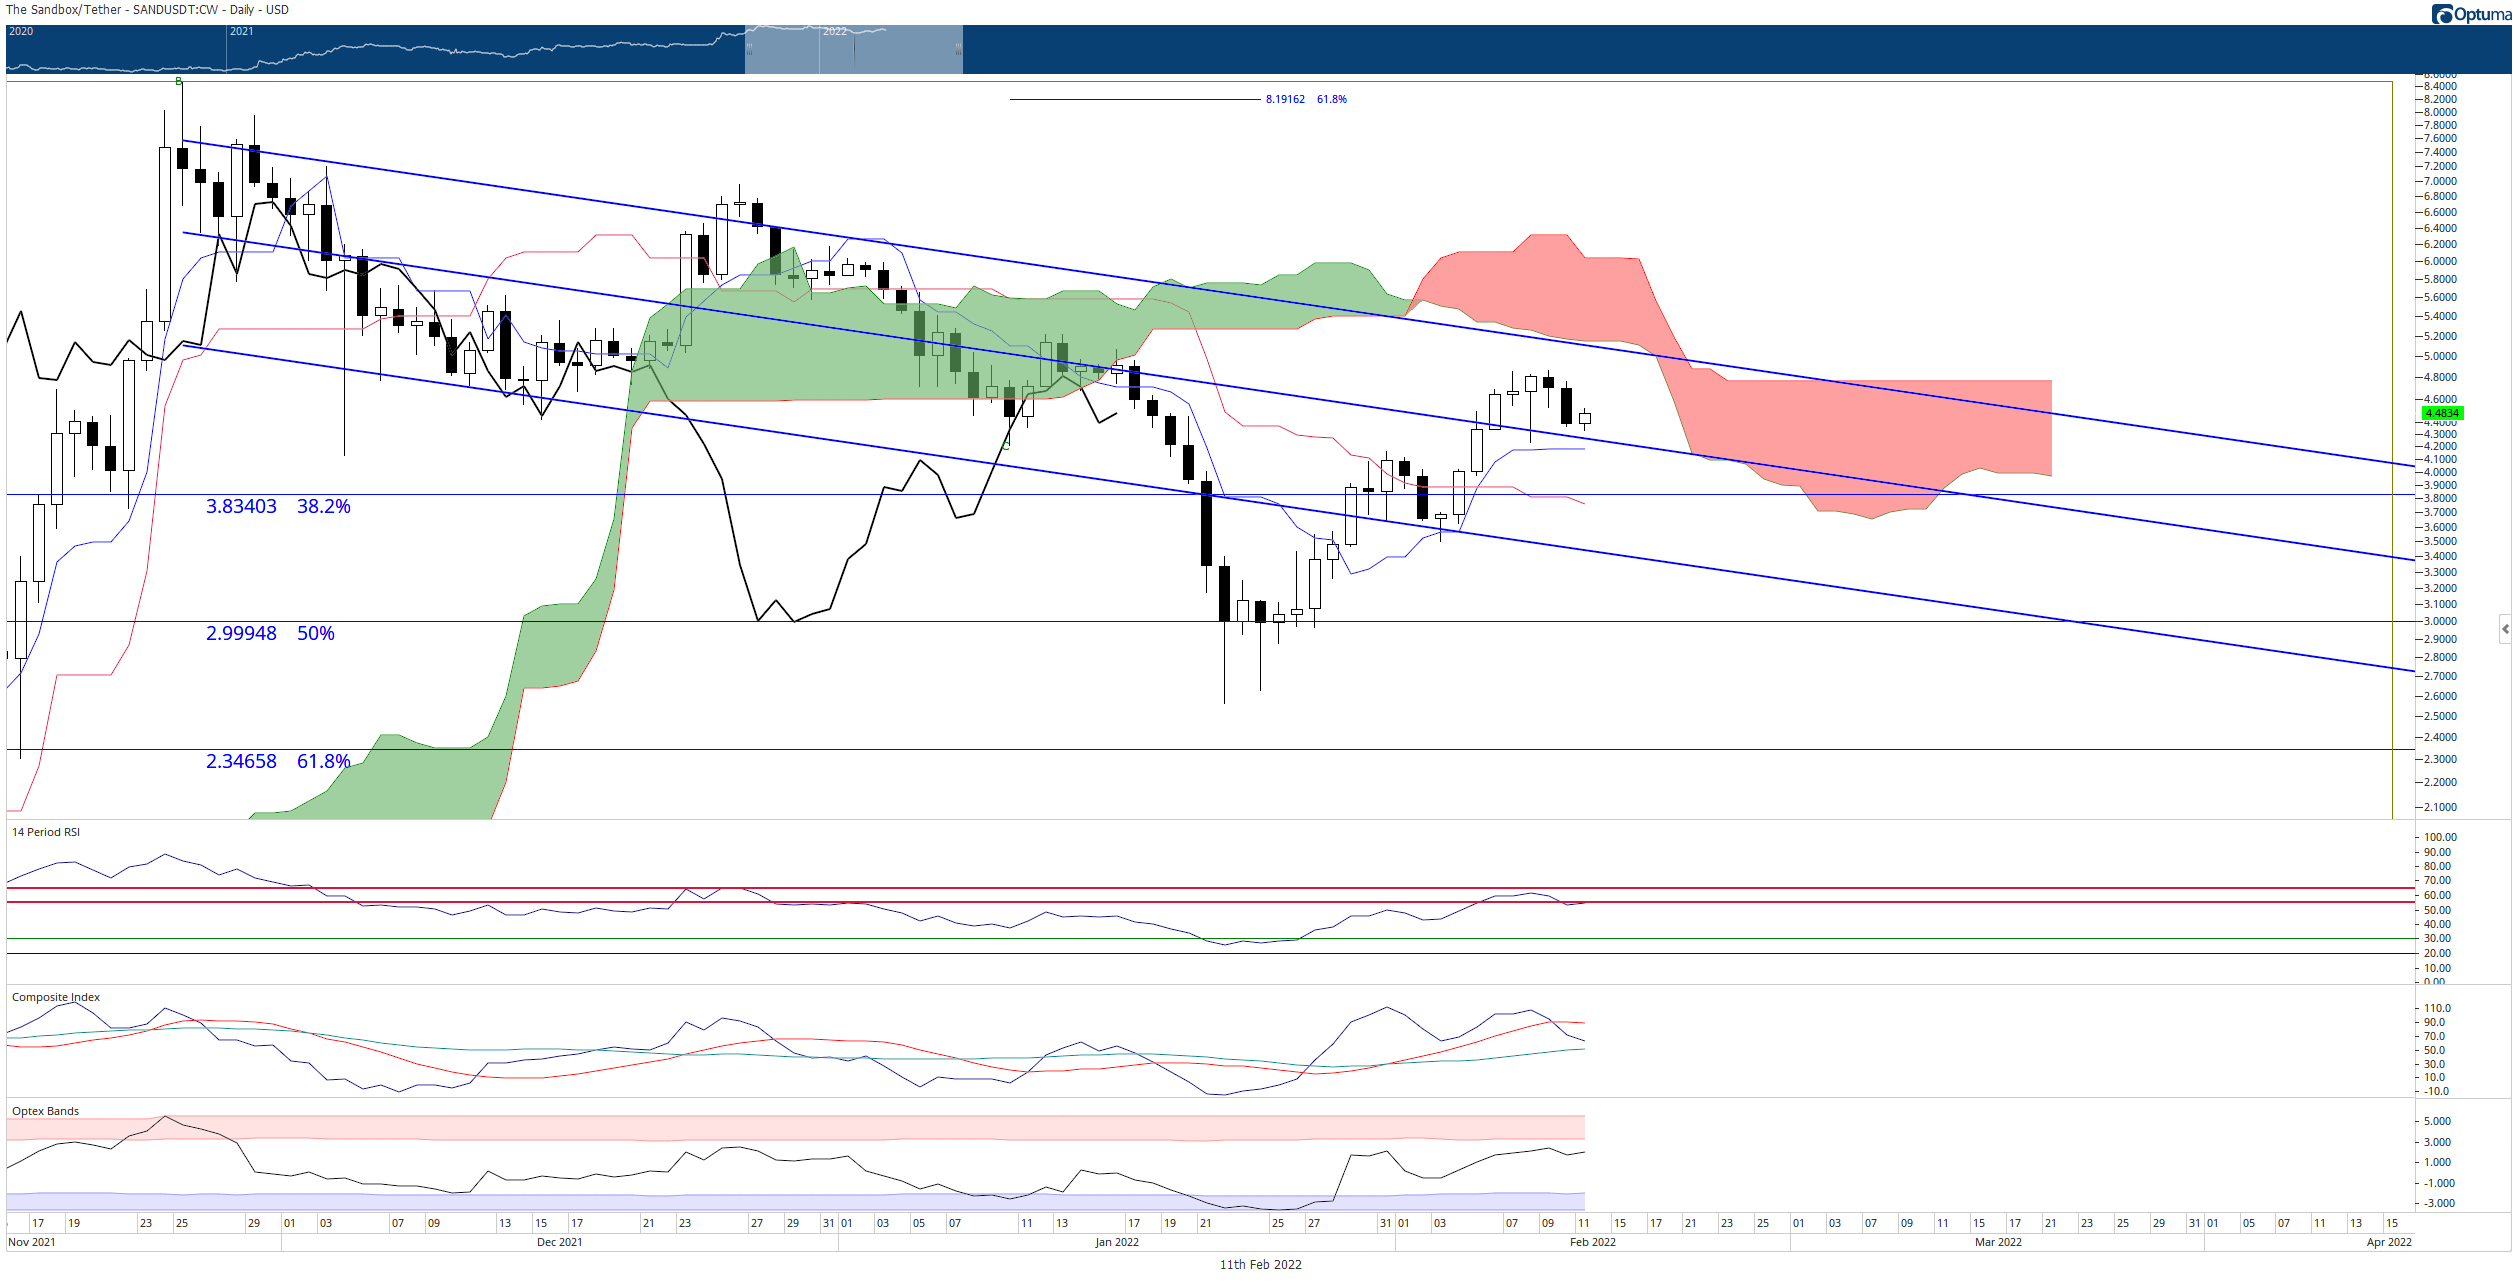
SAND/USDT Daily Ichimoku Kinko Hyo Chart
However, failure to hold support could trigger a significant warning that bearish pressure is not over and that an actual bear market may take over. A close below the Tenkan-Sen at $4.18 would probably create a cascade of major drops until Sandbox price tested the 2022 lows at the 50% Fibonacci retracement at $3.00. The drop would be fast due to the thin Volume Profile. In fact, the lower that SAND moves, the faster the movement lower would occur.
Author

Jonathan Morgan
Independent Analyst
Jonathan has been working as an Independent future, forex, and cryptocurrency trader and analyst for 8 years. He also has been writing for the past 5 years.


