|

SafeMoon Price Prediction: SAFEMOON forms reversal pattern favoring the bears

  • SafeMoon price seems to have formed a trend reversal pattern on the 4-hour chart.
  • If validated, a spike in selling pressure could see SAFEMOON drop by more than 34%. 
  • The only support barrier that may keep falling prices at bay sits at $0.0000070. 

SafeMoon looks primed for a massive correction after losing the $0.0000077 support level. 

SafeMoon price to suffer significant losses

SafeMoon price appears to have developed a head-and-shoulders pattern on its 4-hour chart. Although the pattern’s neckline at $0.0000077 has been violated, the 200 four-hour moving average at $0.0000070 seems to be acting as support.

Breaking through this demand barrier could lead to a 35% decline. Indeed, the head-and-shoulders pattern forecasts that SafeMoon price could plummet to $0.0000049. This target is determined by measuring the distance from the pattern's head to the neckline and adding that distance down from the breakdown point. 

If the selling pressure is significant enough, SafeMoon price might dive further toward $0.0000035 which has acted as a crucial support level throughout April.
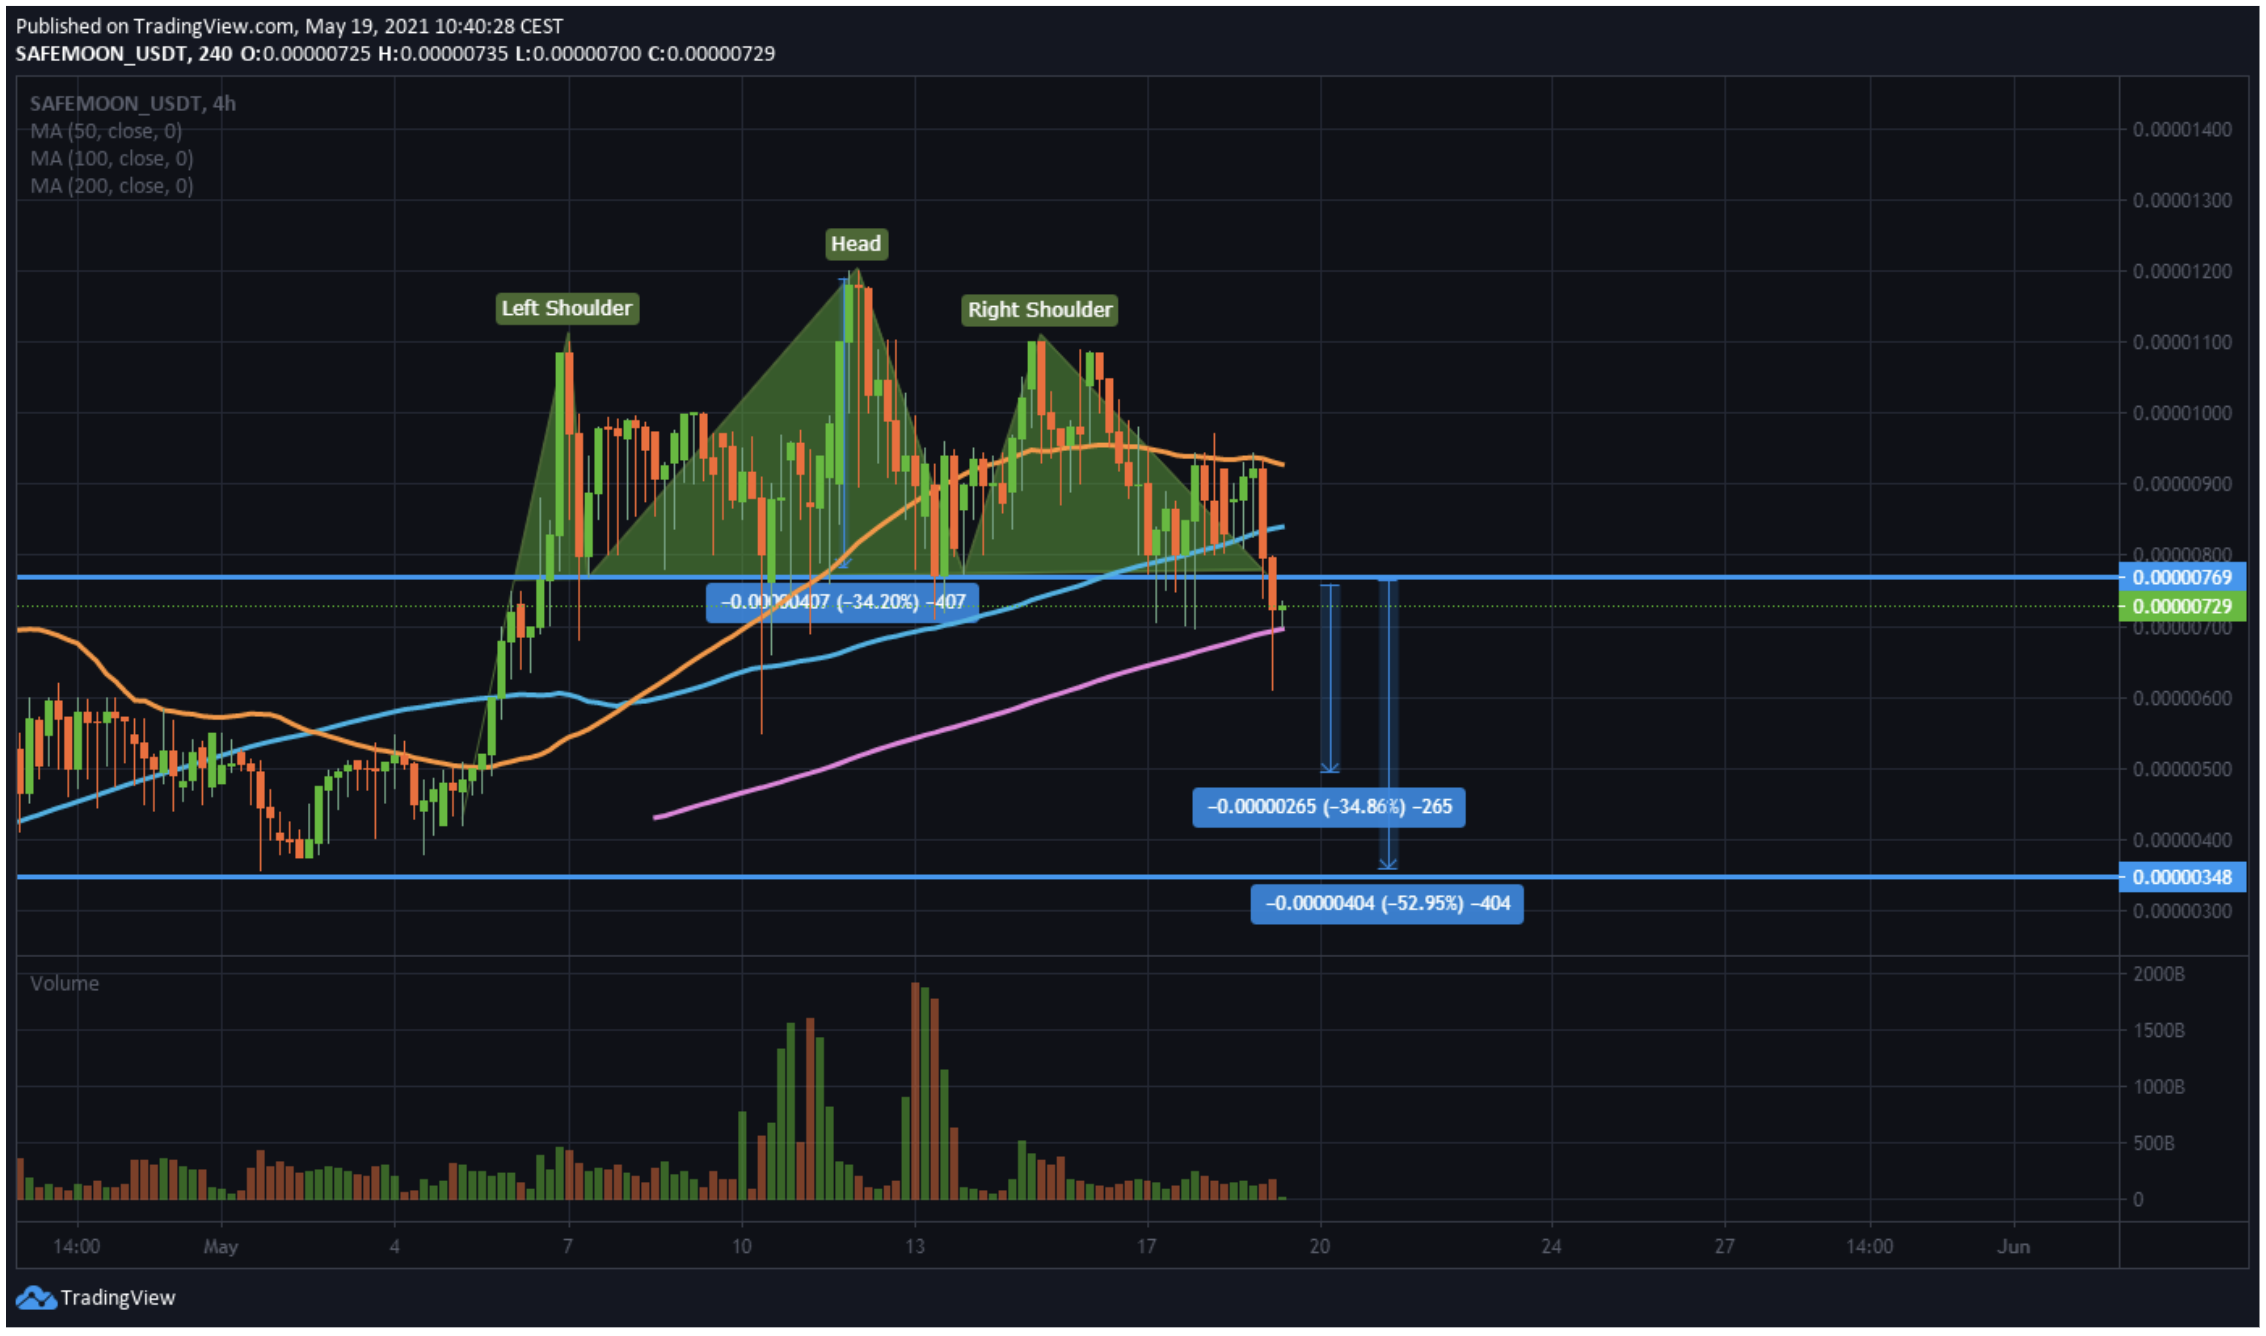
SAFEMOON/USDt 4-hour chart

SAFEMOON/USDt 4-hour chart

Invalidation of the bearish outlook would come if SafeMoon price manages to rise and stay above $0.0000077. Under such circumstances, SAFEMOON might retest the 50 four-hour moving average at $0.0000092.

Author

FXStreet Team

Composed of a group of economic journalists and FX experts, the FXStreet content team produces and oversees all content published on FXStreet. It provides a purely journalistic approach to the Forex market.


More from FXStreet Team
Share:

Editor's Picks

Shiba Inu Price Forecast: SHIB stalls as rising supply on exchanges warns of profit-taking

Shiba Inu stalls above $0.00000500 following two consecutive bullish months as upside momentum eases. Volatile investors' interest in the meme coin amid rising supply on exchanges warns of profit-taking despite consistent token burns.

Dogecoin Price Forecast: Whales accumulate as DOGE uptrend stalls below 200-day EMA

Dogecoin holds a modest bullish bias, trading above the key support zone around $0.090; however, it is capped below the 200-day Exponential Moving Average near $0.094. On-chain data shows certain whale wallets are accumulating DOGE tokens, while strengthening derivatives metrics support a rally ahead for the meme coin.

Ripple and Stellar outlook: Hold bullish bias above EMAs as derivatives back upside

Ripple and Stellar hold above the key support zones, hinting at an upside move. Derivatives metrics further support the recovery, with both altcoins showing positive funding rates and rising long positions. Derivatives data shows a bullish tilt among XRP and XLM traders.

Crypto Market Overview: Bitcoin steadies below $80,000 – INJ, AERO rally
Bitcoin (BTC) hovers around $79,000 on Tuesday, struggling to break above the sell wall between $80,000 and $82,850. The broader cryptocurrency market sentiment remains bullish, with the Fear and Greed Index showing a reading of 73. Injective (INJ) and Aerodrome Finance (AERO) post double-digit gains over the last 24 hours.
Bitcoin: Gearing up for a sharp move
Bitcoin (BTC) is trading around $81,000 on Friday, up over 4% so far this week, and awaits a key catalyst that could determine its next directional move. Strong institutional demand is supporting the bullish price action, with spot BTC Exchange Traded Funds (ETFs) on track to record a third straight week of inflows.

