SafeMoon Price Forecast: SAFEMOON bounce misleads, risks remain to the downside
- SafeMoon price triggers irregular head-and-shoulders topping pattern.
- 4-hour Ichimoku Cloud remains a price magnet, containing price losses.
- SAFEMOON rewards long-term ownership by penalizing sellers with a 10% fee.

SafeMoon price triggered the head-and-shoulders top on May 16 with a trade below the neckline at $0.00000882. SAFEMOON has rebounded, but the bearish outlook remains active.
SafeMoon price has lost the cosmic euphoria
For the unaware, SAFEMOON is a new cryptocurrency that began trading in March 2021. The digital token began trading at $0.000000001 and a tiny market capitalization. According to Bitmart, SafeMoon price catapulted to $0.000015 by April 20, yielding a tremendous return for brave investors. However, it followed the giant rally with a 90% decline into April 21.
SAFEMOON has a maximum supply of 10 quadrillion tokens but only has 600 billion in circulation. It is a deflationary currency, as supply declines over time. Still, some have called it a pyramid scheme because sellers of the token are charged a 10% fee. 5% is distributed to SAFEMOON investors and the other 5% of the fee is split 50/50, half of which is sold by the contract into BNB, while the other half of the SAFEMOON tokens are paired automatically with the previously mentioned BNB and added as a liquidity pair on Pancake Swap. Investors are dependent on more people buying SAFEMOON to increase their investment.
On the 4-hour chart, SafeMoon price has rebounded from the decline below the neckline of an irregular head-and-shoulders topping pattern. The rebound has been contained along the Ichimoku Cloud, and SAFEMOON remains below the neckline.
Based on the topping pattern, the measured move target is $0.00000478, yielding a loss of over 45% from the neckline break on May 16 and a similar loss from price at the time of writing. The only two obstacles between SafeMoon price and the measured move target are the 200 four-hour simple moving average (SMA) at $0.0000068709 and the May 10 low at $0.00000550.
The bearish outlook will continue unless SafeMoon price rallies above the right shoulder high at $0.00001100.
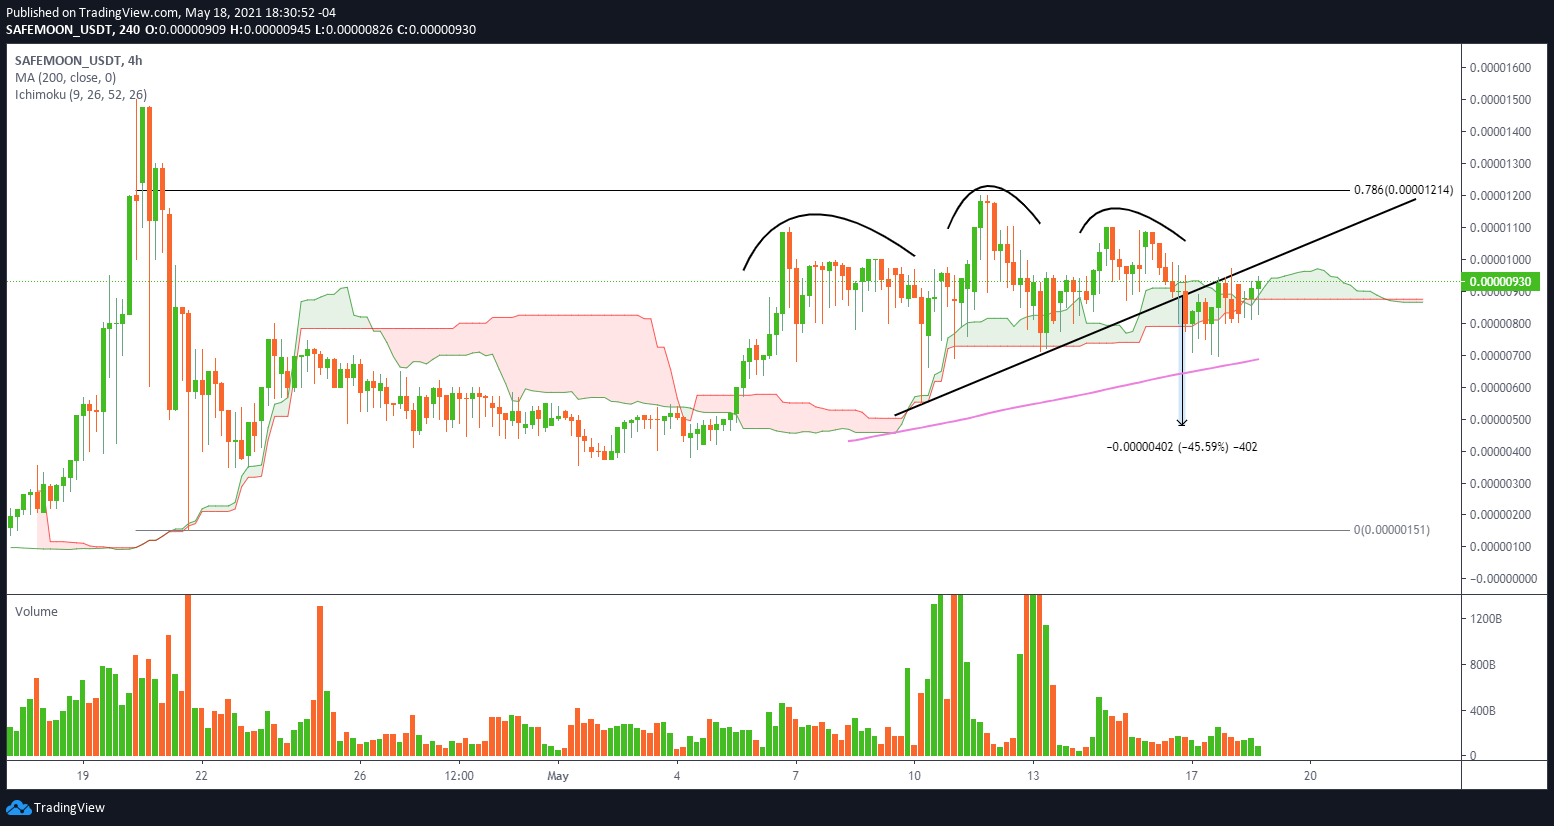
SAFEMOON/USD 4-hour chart
Suppose SafeMoon price does rise above the right shoulder and the 78.6% Fibonacci retracement of the April crash at $0.00001213. In that case, SAFEMOON will not discover any resistance until the April 20 high at $0.00001500.
Author

Sheldon McIntyre, CMT
Independent Analyst
Sheldon has 24 years of investment experience holding various positions in companies based in the United States and Chile. His core competencies include BRIC and G-10 equity markets, swing and position trading and technical analysis.


