SafeMoon Price Prediction: SAFEMOON drops 27%, but any rebound should be sold
- SafeMoon price compression is beginning to release as cryptocurrency resolves the descending triangle to the downside.
- SAFEMOON daily Relative Strength Index (RSI) enters oversold territory, potentially limiting the downside in the short term.
- Daily volume has not spiked on the weakness over the last four trading sessions, indicating no run for the exits yet.

SafeMoon price shaped a descending triangle pattern since the May collapse, with the May 19 low of $0.00000261 serving as the horizontal support for the triangle. Finally, on July 28, SAFEMOON logged a daily close below the May 19 low, triggering the bearish pattern. Despite the oversold condition on the daily RSI, the outlook for the altcoin is still bearish as the previous price contraction will lead to further price expansion.
SafeMoon price negative deviation from crypto market spells trouble
In July, the tightening of SafeMoon price squeezed the daily Bollinger Bands to the tightest reading since the inception of trading, as measured by the Bollinger Band Width (BBW). The significant SAFEMOON price contraction and the pressure enforced by the declining 20-day simple moving average (SMA) established the basis for a substantial resolution of the descending triangle pattern, with the triangle carrying a bearish bias.
Since the triangle resolution to the downside on July 28, SafeMoon price has dropped 27% at today’s low of $0.00000190, but still far from the measured move downside target of $0.00000111. A decline beyond the measured move target would find support at the April descending trend line at $0.00000089, representing a 60% decline from the current price. The level corresponds to price congestion at the beginning of April.
To achieve the bearish targets outlined above, look for panic in volume. Based on the daily volume figures, the 27% decline has not been engineered by a rush for the exits, forging the potential for a rebound as the daily RSI has touched the oversold territory. Thus, for SAFEMOON investors with a shorter-term outlook, it may be advantageous to capture the gains.
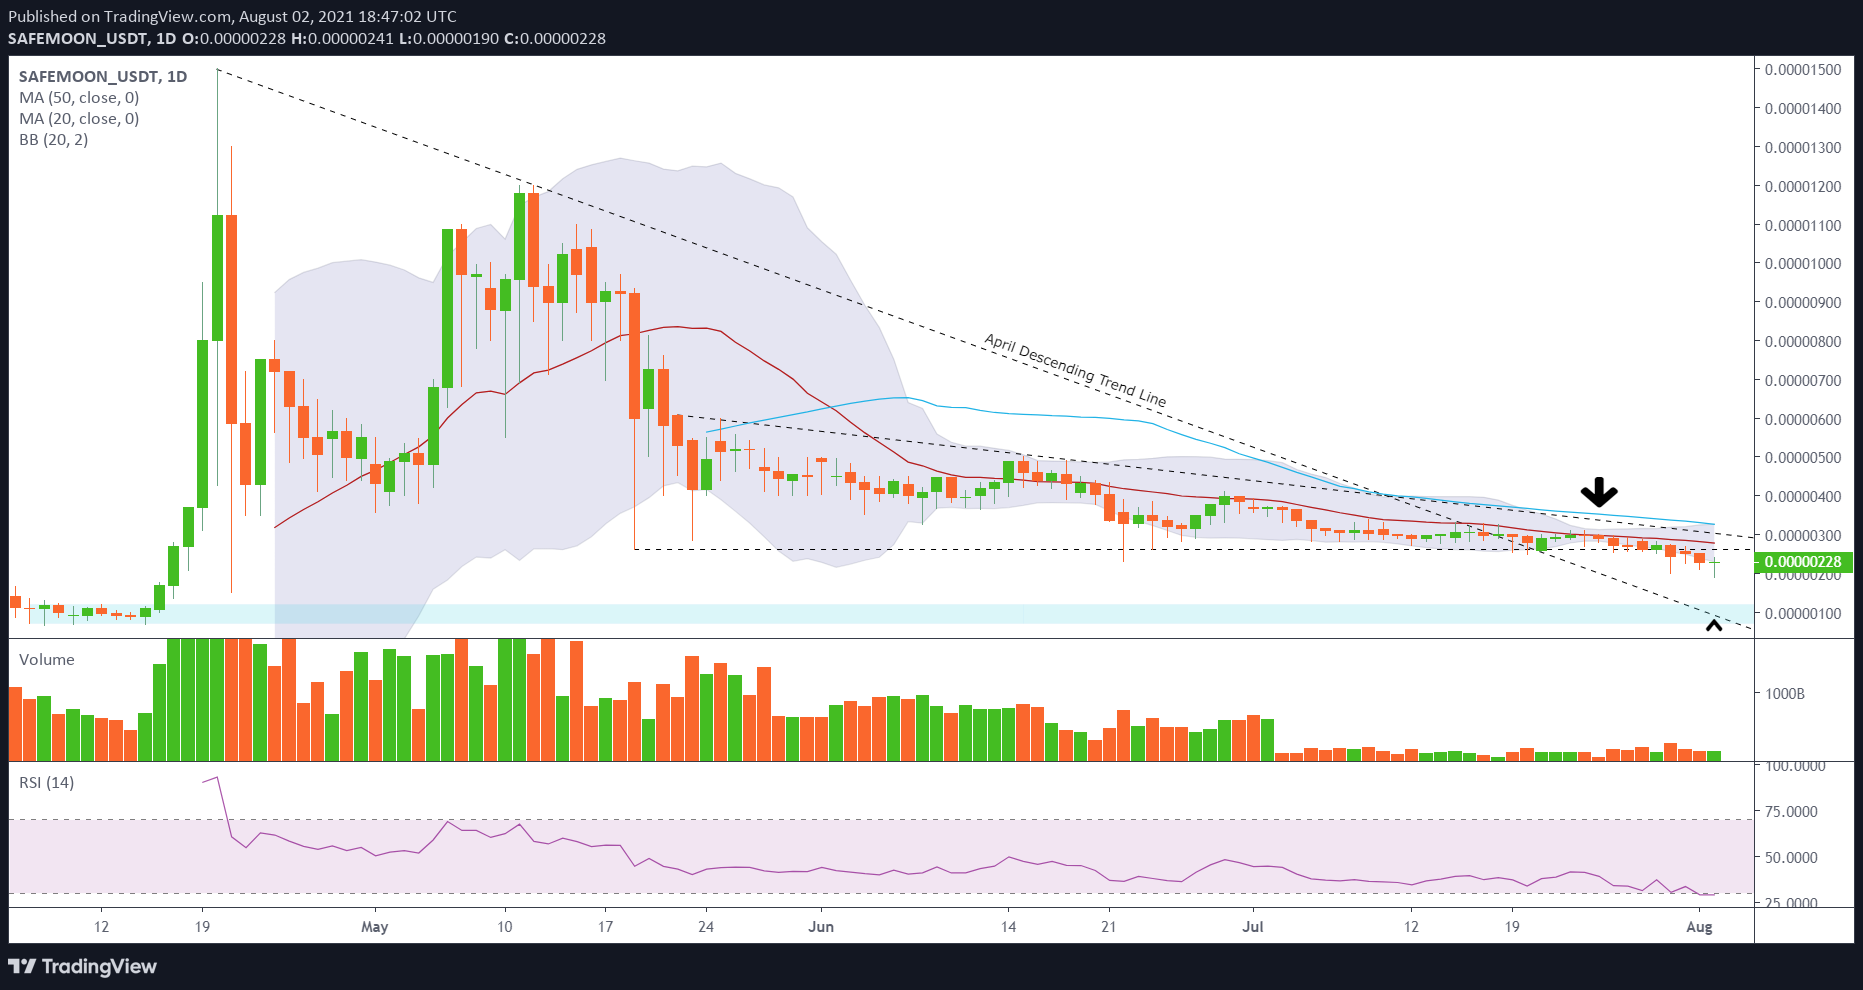
SAFEMOON/USD daily chart
For those investors not participating in the decline, there is no reason to entertain a long position until SafeMoon price recaptures the May 19 low of $0.00000261. Even then, the upside is met with heavy resistance, including the 20-day SMA at $0.00000277, the upper trend line of the descending triangle and the 50-day SMA at $0.00000326.
Overall, the negative deviation of SafeMoon price from the bullish trend in the cryptocurrency complex since July 21 is confirmation that the SAFEMOON outlook remains full of questions and few answers, especially when there is no FOMO to hide the sources of bearish concern. As a result, it may be a signal of more trouble to come.
Author

Sheldon McIntyre, CMT
Independent Analyst
Sheldon has 24 years of investment experience holding various positions in companies based in the United States and Chile. His core competencies include BRIC and G-10 equity markets, swing and position trading and technical analysis.


