SafeMoon price eyes a pullback amid oversold conditions before next downswing kicks in
- SAFEMOON price poised for a rebound but not out of the woods yet.
- Bear flag breakdown on the daily chart targets $0.0000012.
- RSI peeps into the oversold territory, warranting caution for the bears.

SafeMoon price is in a downside consolidation mode near multi-month lows of $0.000001934, briefly pausing three straight days of heavy declines.
Bears take a breather this Saturday, contemplating the next move, with technical and fundamental factors sending caution signals. The meme-based coin is down over 10% on the day.
SafeMoon optimists are seemingly waiting for that one ray of hope to lift SAFEMOON price from the ongoing downbeat momentum.
That said, the SafeMoon developers have revealed August 7 as the beta launch of its Android-specific mobile wallet, which could emerge as the much-needed bullish catalyst to end the losing streak.
SAFEMOON/USD: At a critical juncture
SafeMoon price brought an end to its ten-day-long range trade at lower levels, following a daily closing below the rising trendline support at $0.00000236 that validated a bear flag formation.
The downside breakout accelerated the downside, triggering steep losses while opening floors towards the pattern target measured at $0.0000012.
The consolidation that followed SAFEMOON’s downtrend from the June 29 high of $0.00000352 had carved out a bear flag pattern on the daily chart.
Ahead of that, the $0.0000015 round number could lend some support to the bulls.
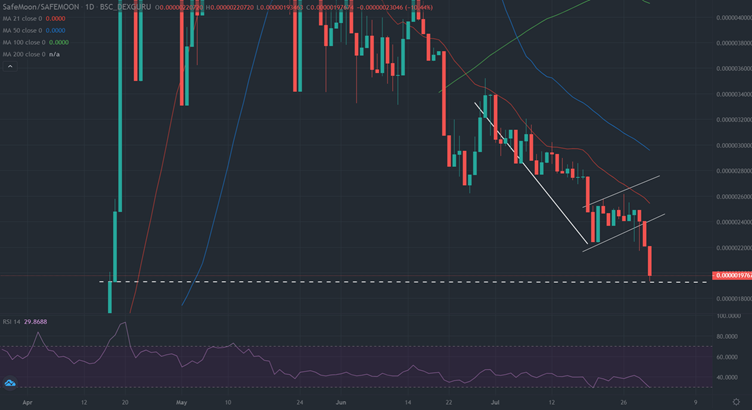
SAFEMOON/USD: Daily chart
However, with the 14-day Relative Strength Index (RSI) peeping into the oversold region, currently at 29.81, a rebound from the key horizontal (dashed) trendline support near $0.000001930 cannot be ruled out. That level is the confluence of the daily and April 18 lows.
Subsequently, if the buyers manage to seize control, then they could lookout for a recovery rally towards the pattern support-turned-resistance, now at $0.000000241.
Author

Dhwani Mehta
FXStreet
Residing in Mumbai (India), Dhwani is a Senior Analyst and Manager of the Asian session at FXStreet. She has over 10 years of experience in analyzing and covering the global financial markets, with specialization in Forex and commodities markets.


