SafeMoon price finds strong support, increasing bullish potential for $0.00000147
- SafeMoon price is still in a strong downtrend.
- The RSI is nearing the oversold area.
- With volume on the thin side, a bull is just around the corner.

SafeMoon (SAFEMOON) price is in a downtrend for most of September. With the Relative Strength Index (RSI) nearing the oversold region, bulls will start to gain an appetite to pick up some SAFEMOON. Bulls can easily match and squeeze sellers out of any short-term position with the volume on the thin side. To the upside, the 10-day Simple Moving Average (SMA) will be the first resistance bulls should face around $0.00000140.
SafeMoon bulls can make a reentrance toward $0.00000140
SafeMoon price action is on a long-term downward trajectory and is still looking for a floor in its price action. That floor might have been found around $0.00000120. Reasons for the floor formation come with the RSI nearing 30 again, which spells overbought status. This element should be on the radar of bulls and attract some interest in them. Next to that, an entry would look attractive, as the volume in SAFEMOON is wearing thin, and it would be easy to run price action up if the sellers’ volume is matched with buying action multiple times larger by volume. That would cause a nice squeeze in SafeMoon to the upside.
SAFEMOON price faces the first hurdle on its northern path with the 10-day SMA at $0.00000140.That should only count as an intermediary level for any profit-taking. The real profit level that bulls would need to see is $0.00000147, which falls in line with the 30-day SMA.
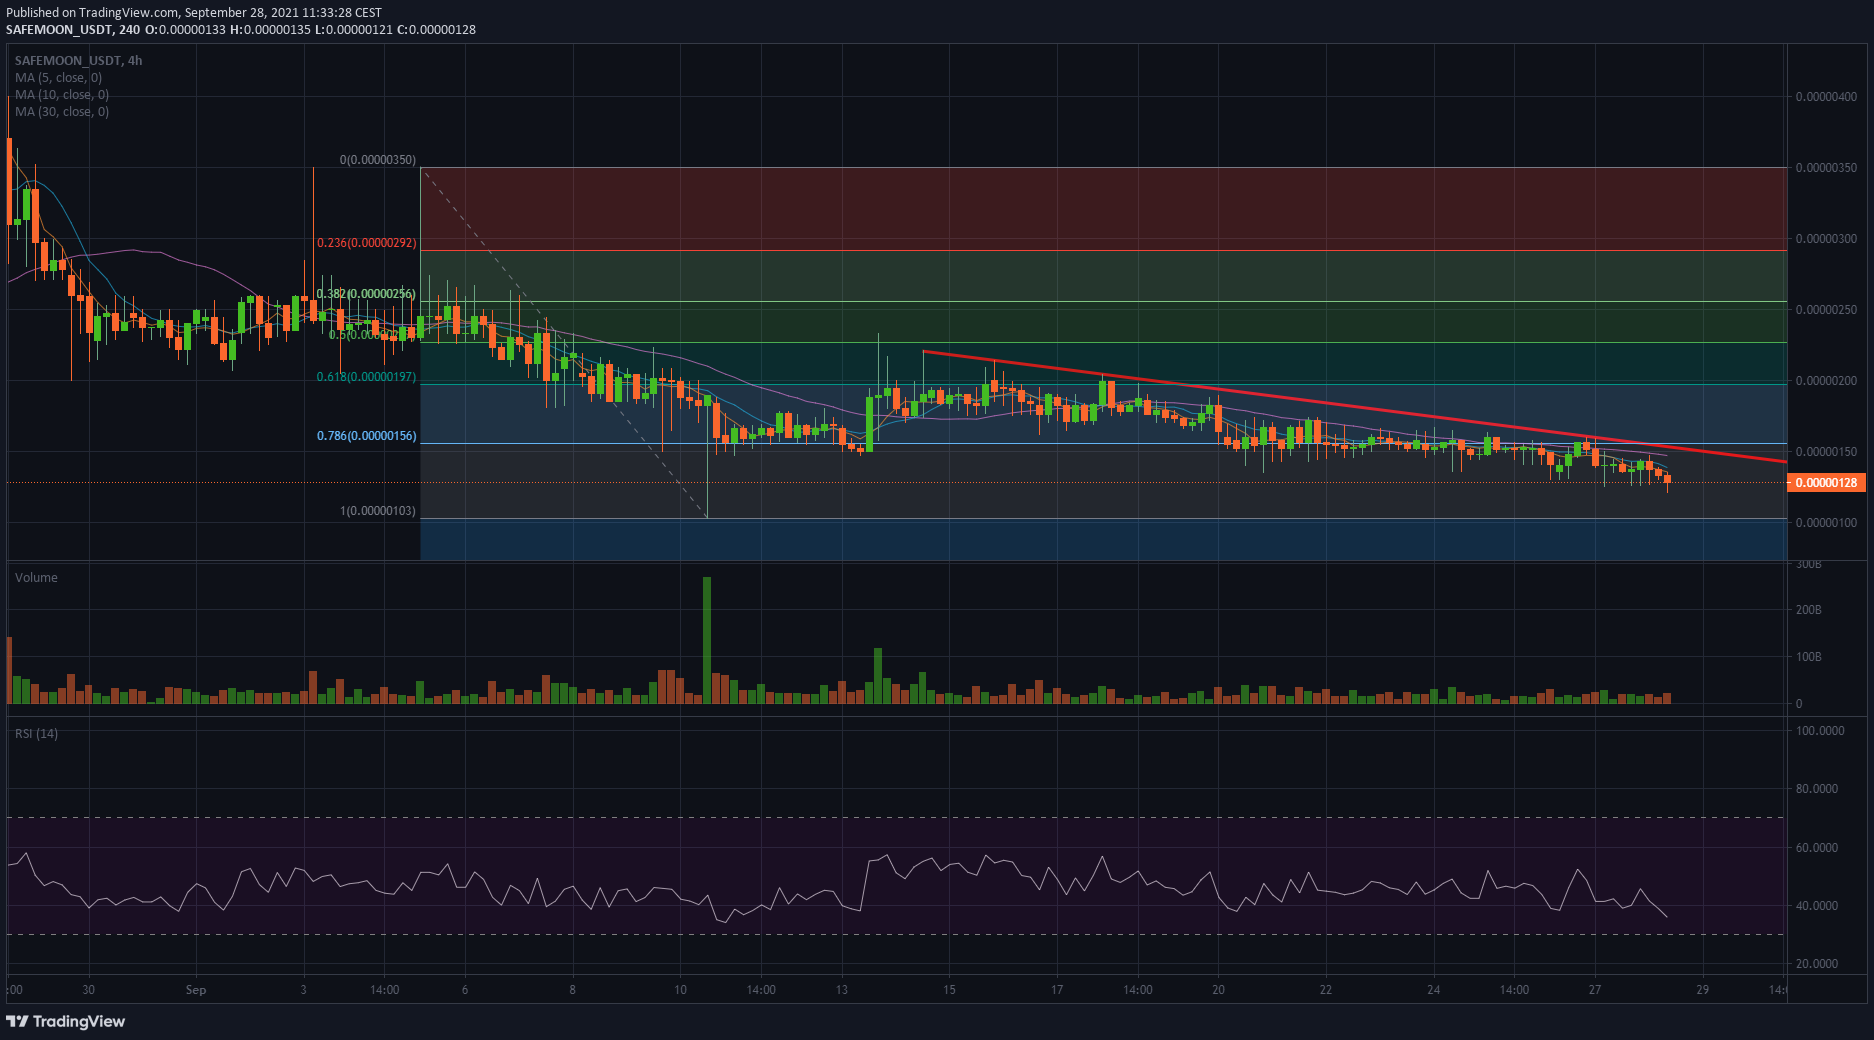
SAFEMOON/USD 4H-chart
A retest of the red descending trend line is possible, but sellers in SafeMoon will be vigorous to defend their levels. Expect SafeMoon price action to be relatively muted once above the 30-day SMA at $0.00000147.
Should market sentiment turn further to the downside in a couple of days, expect a retest of $0.00000120 with the RSI dipping its toes sub-30. That, again, should be a reason to attract a few buyers to the party and allow for some counter moves back toward $0.00000140.
Like this article? Help us with some feedback by answering this survey:
Author

Filip Lagaart
FXStreet
Filip Lagaart is a former sales/trader with over 15 years of financial markets expertise under its belt.


