SafeMoon remains in a downtrend torward $0.000001
- SafeMoon price is void of any near-term bullish reversal patterns.
- Bears continue to have a tight and strict hold over the market.
- All Ichimoku indicators point to lower prices.

SafeMoon price is in a clear downtrend without any reprieve in sight. SafeMoon is hands down one of the ugliest and most bearish-looking charts in the entire cryptocurrency space. Except for some price spikes and false rallies between August 18th and August 28th, There has been almost no period of time on the SafeMoon chart where one could consider it bullish.
SafeMoon price continues downward slide, bears in total control
SafeMoon price is a textbook example of what an ultimate bearish Ichimoku chart looks like:
- Futures Span A below Future Span B
- Tenkan-Sen below the Kijun-Sen
- Tenkan-Sen and Kijun-Sen below the Cloud.
- Close below the Tenkan-Sen, Kijun-Sen and Cloud.
- Chikou Span below the Cloud and the candlesticks.
Every single requirement for a bearish outlook is fulfilled on the SafeMoon price chart. Only one oscillator gives any hope to some temporary stay of the relentless selling pressure on SafeMoon. The Composite Index has regular bullish divergence and it has crossed above its slow and fast-moving averages. Generally, this is a good sign and sign of an incoming upswing. However, since the Relative Strength Index continues to flounder near the 40 level, support does not seem likely.
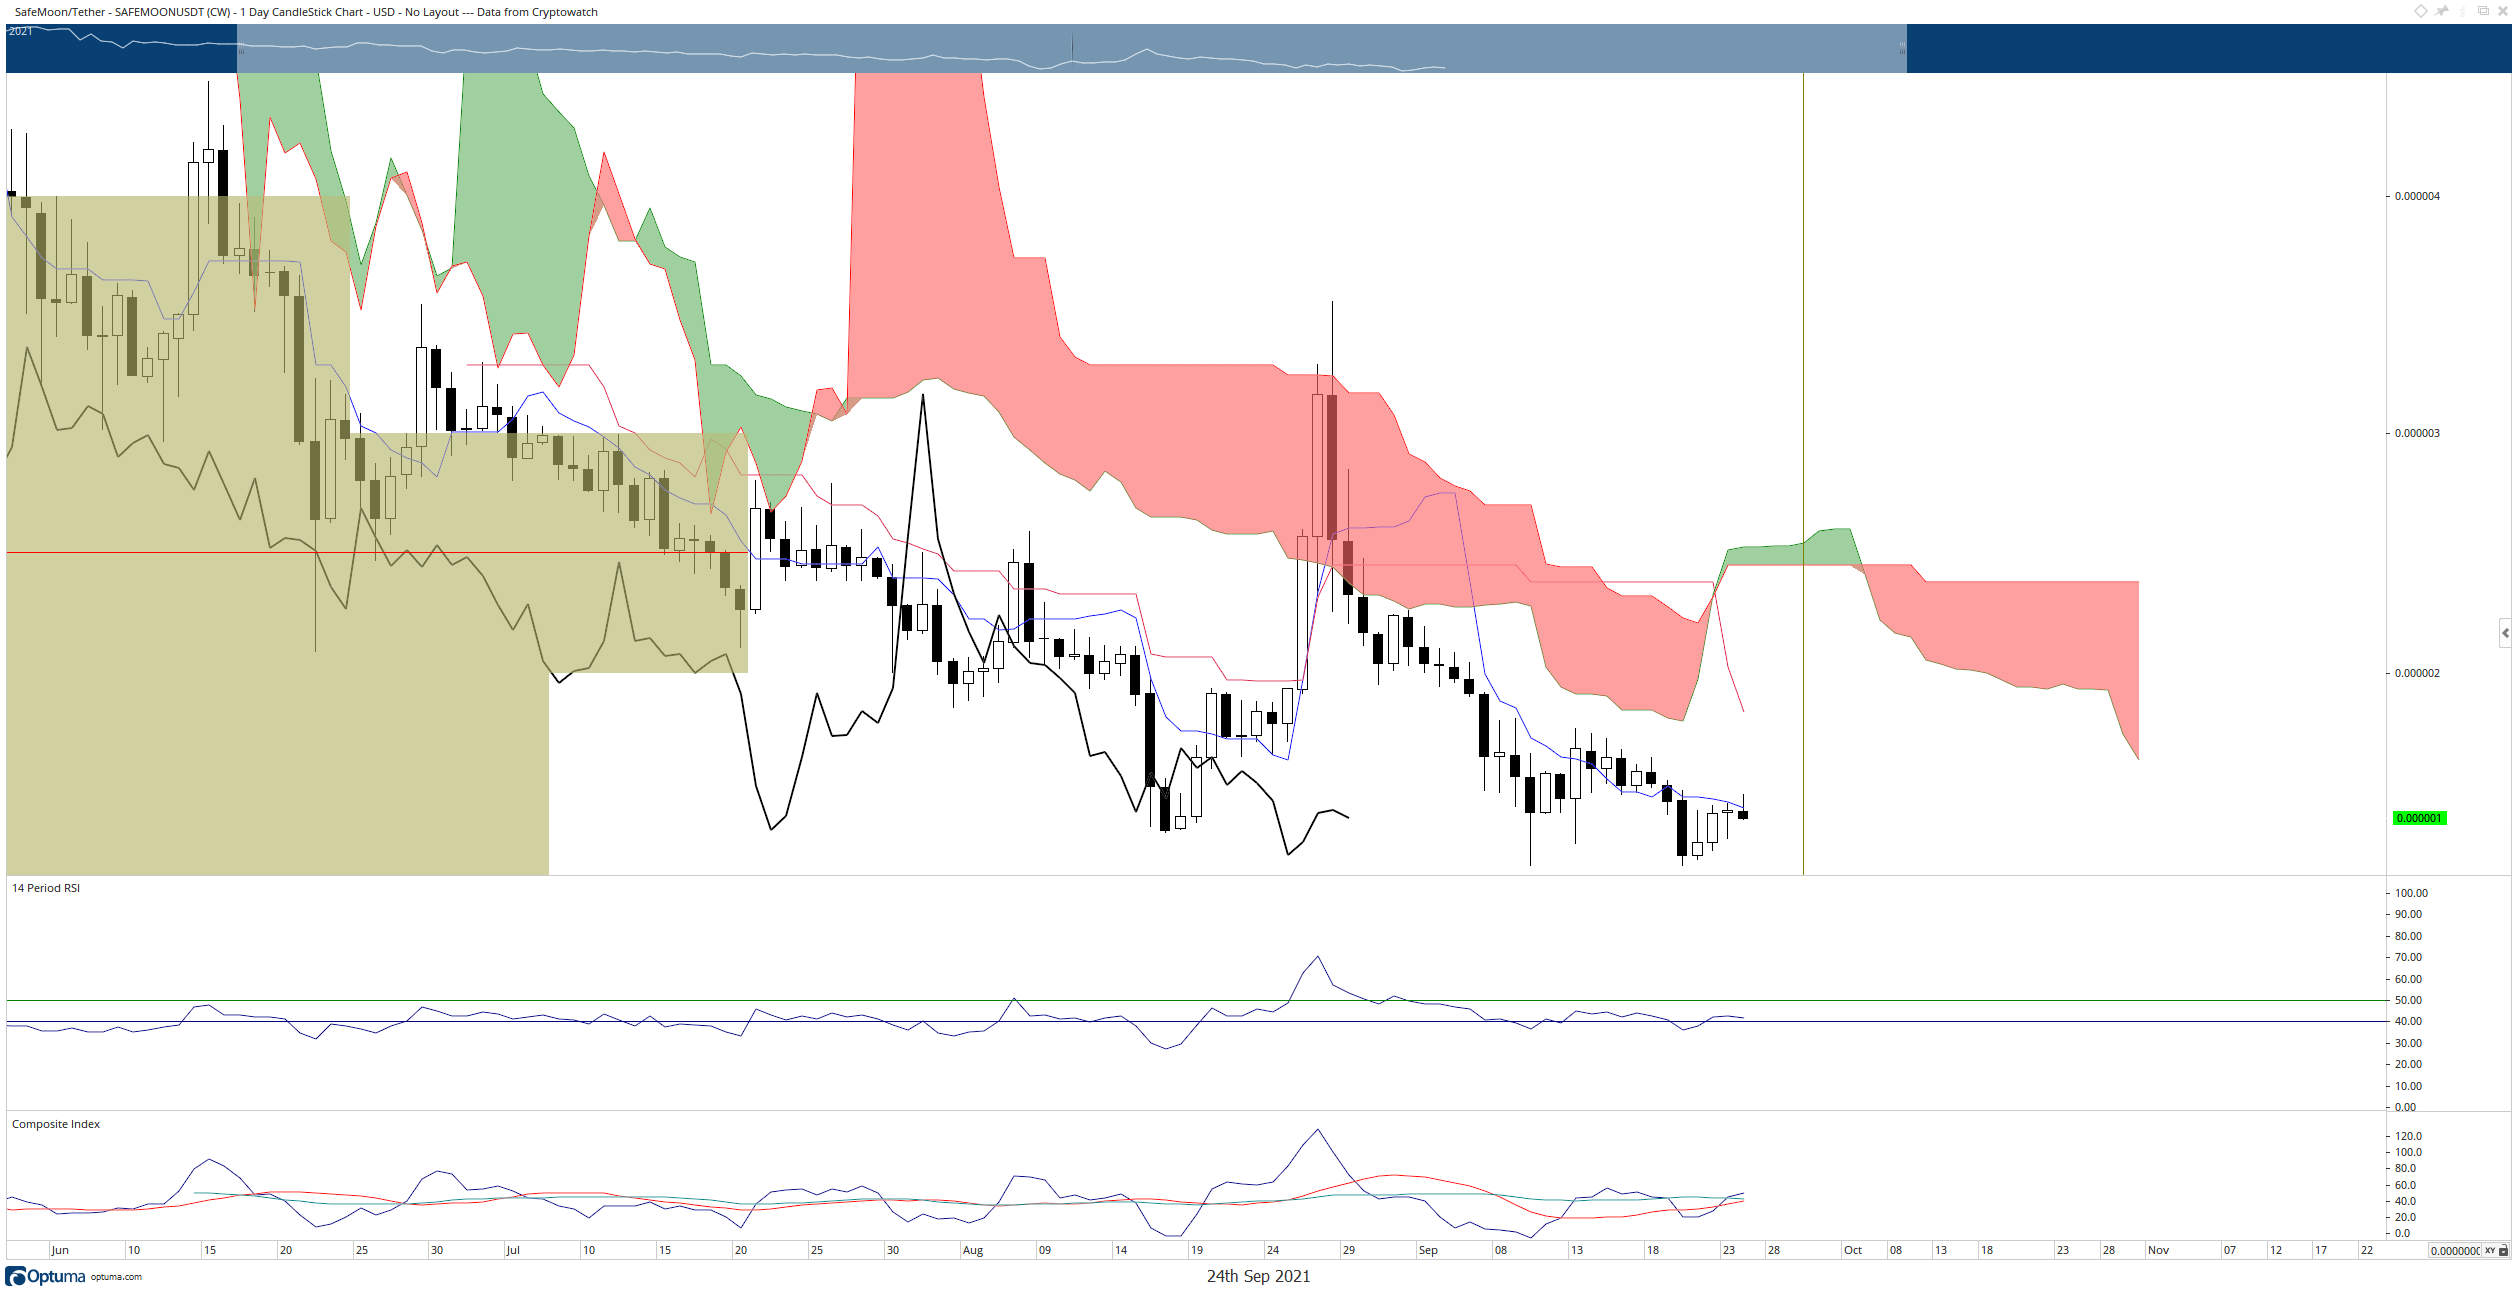
SafeMoon/USDT Daily Ichimoku Chart
For bulls to invalidate this move, SafeMoon price needs to return to a level above the 2021 Volume-Point-Of-Control at $0.00003. A return to $0.000003 would also put SafeMoon price above the Tenkan-Sen, Kijun-Sen, Senkou Span A and Senkou Span B – creating conditions that would probably yield some new bullish momentum.
Like this article? Help us with some feedback by answering this survey:
Author

Jonathan Morgan
Independent Analyst
Jonathan has been working as an Independent future, forex, and cryptocurrency trader and analyst for 8 years. He also has been writing for the past 5 years.


