• SafeMoon price prepares for a 32% plunge after losing a crucial foothold.
  • The altcoin could be supported by the demand zone that extends from $0.00000135 to $0.00000146.
  • SAFEMOON bulls would need to aim for $0.00000186 to be out of danger.

SafeMoon price has slid below a crucial support level that could indicate that a steep decline is on the horizon. SAFEMOON could be heading for a 32% drop as the buyers continue to retreat, leaving the altcoin to slide lower.

SafeMoon bulls prepare to cut losses

SafeMoon price has formed a symmetrical triangle pattern on the 4-hour chart, which suggested that there was an equilibrium between buyers and sellers. 

However, the technical pattern that indicates indecision has broken out to favor the bears, as SAFEMOON slid below the lower boundary of the triangle at $0.00000166. 

The downside trend line of the governing chart pattern acted as support for SafeMoon price since September 14. The altcoin falling below the line of defense has provided investors a hint as to where SAFEMOON is headed next.

The prevailing technical pattern suggests that SafeMoon price is at risk of a 32% fall, targeting $0.00000112. Before SAFEMOON sellers attempt to reach the pessimistic target, it has a few lines of defense that could save the altcoin from the bearish outlook.

SafeMoon price would discover the first area of support at the 23.6% Fibonacci retracement level at $0.00000161. Should the altcoin face further selling pressure, SAFEMOON would find an additional foothold at the demand zone that extends from $0.00000135 to $0.00000146. 

If the bears continue to take control, SafeMoon price would eventually witness the bearish thesis emerge, and SAFEMOON may tag the downside target given by the technical pattern at $0.00000116, should the 32% drop materialize.

SAFEMOON crash

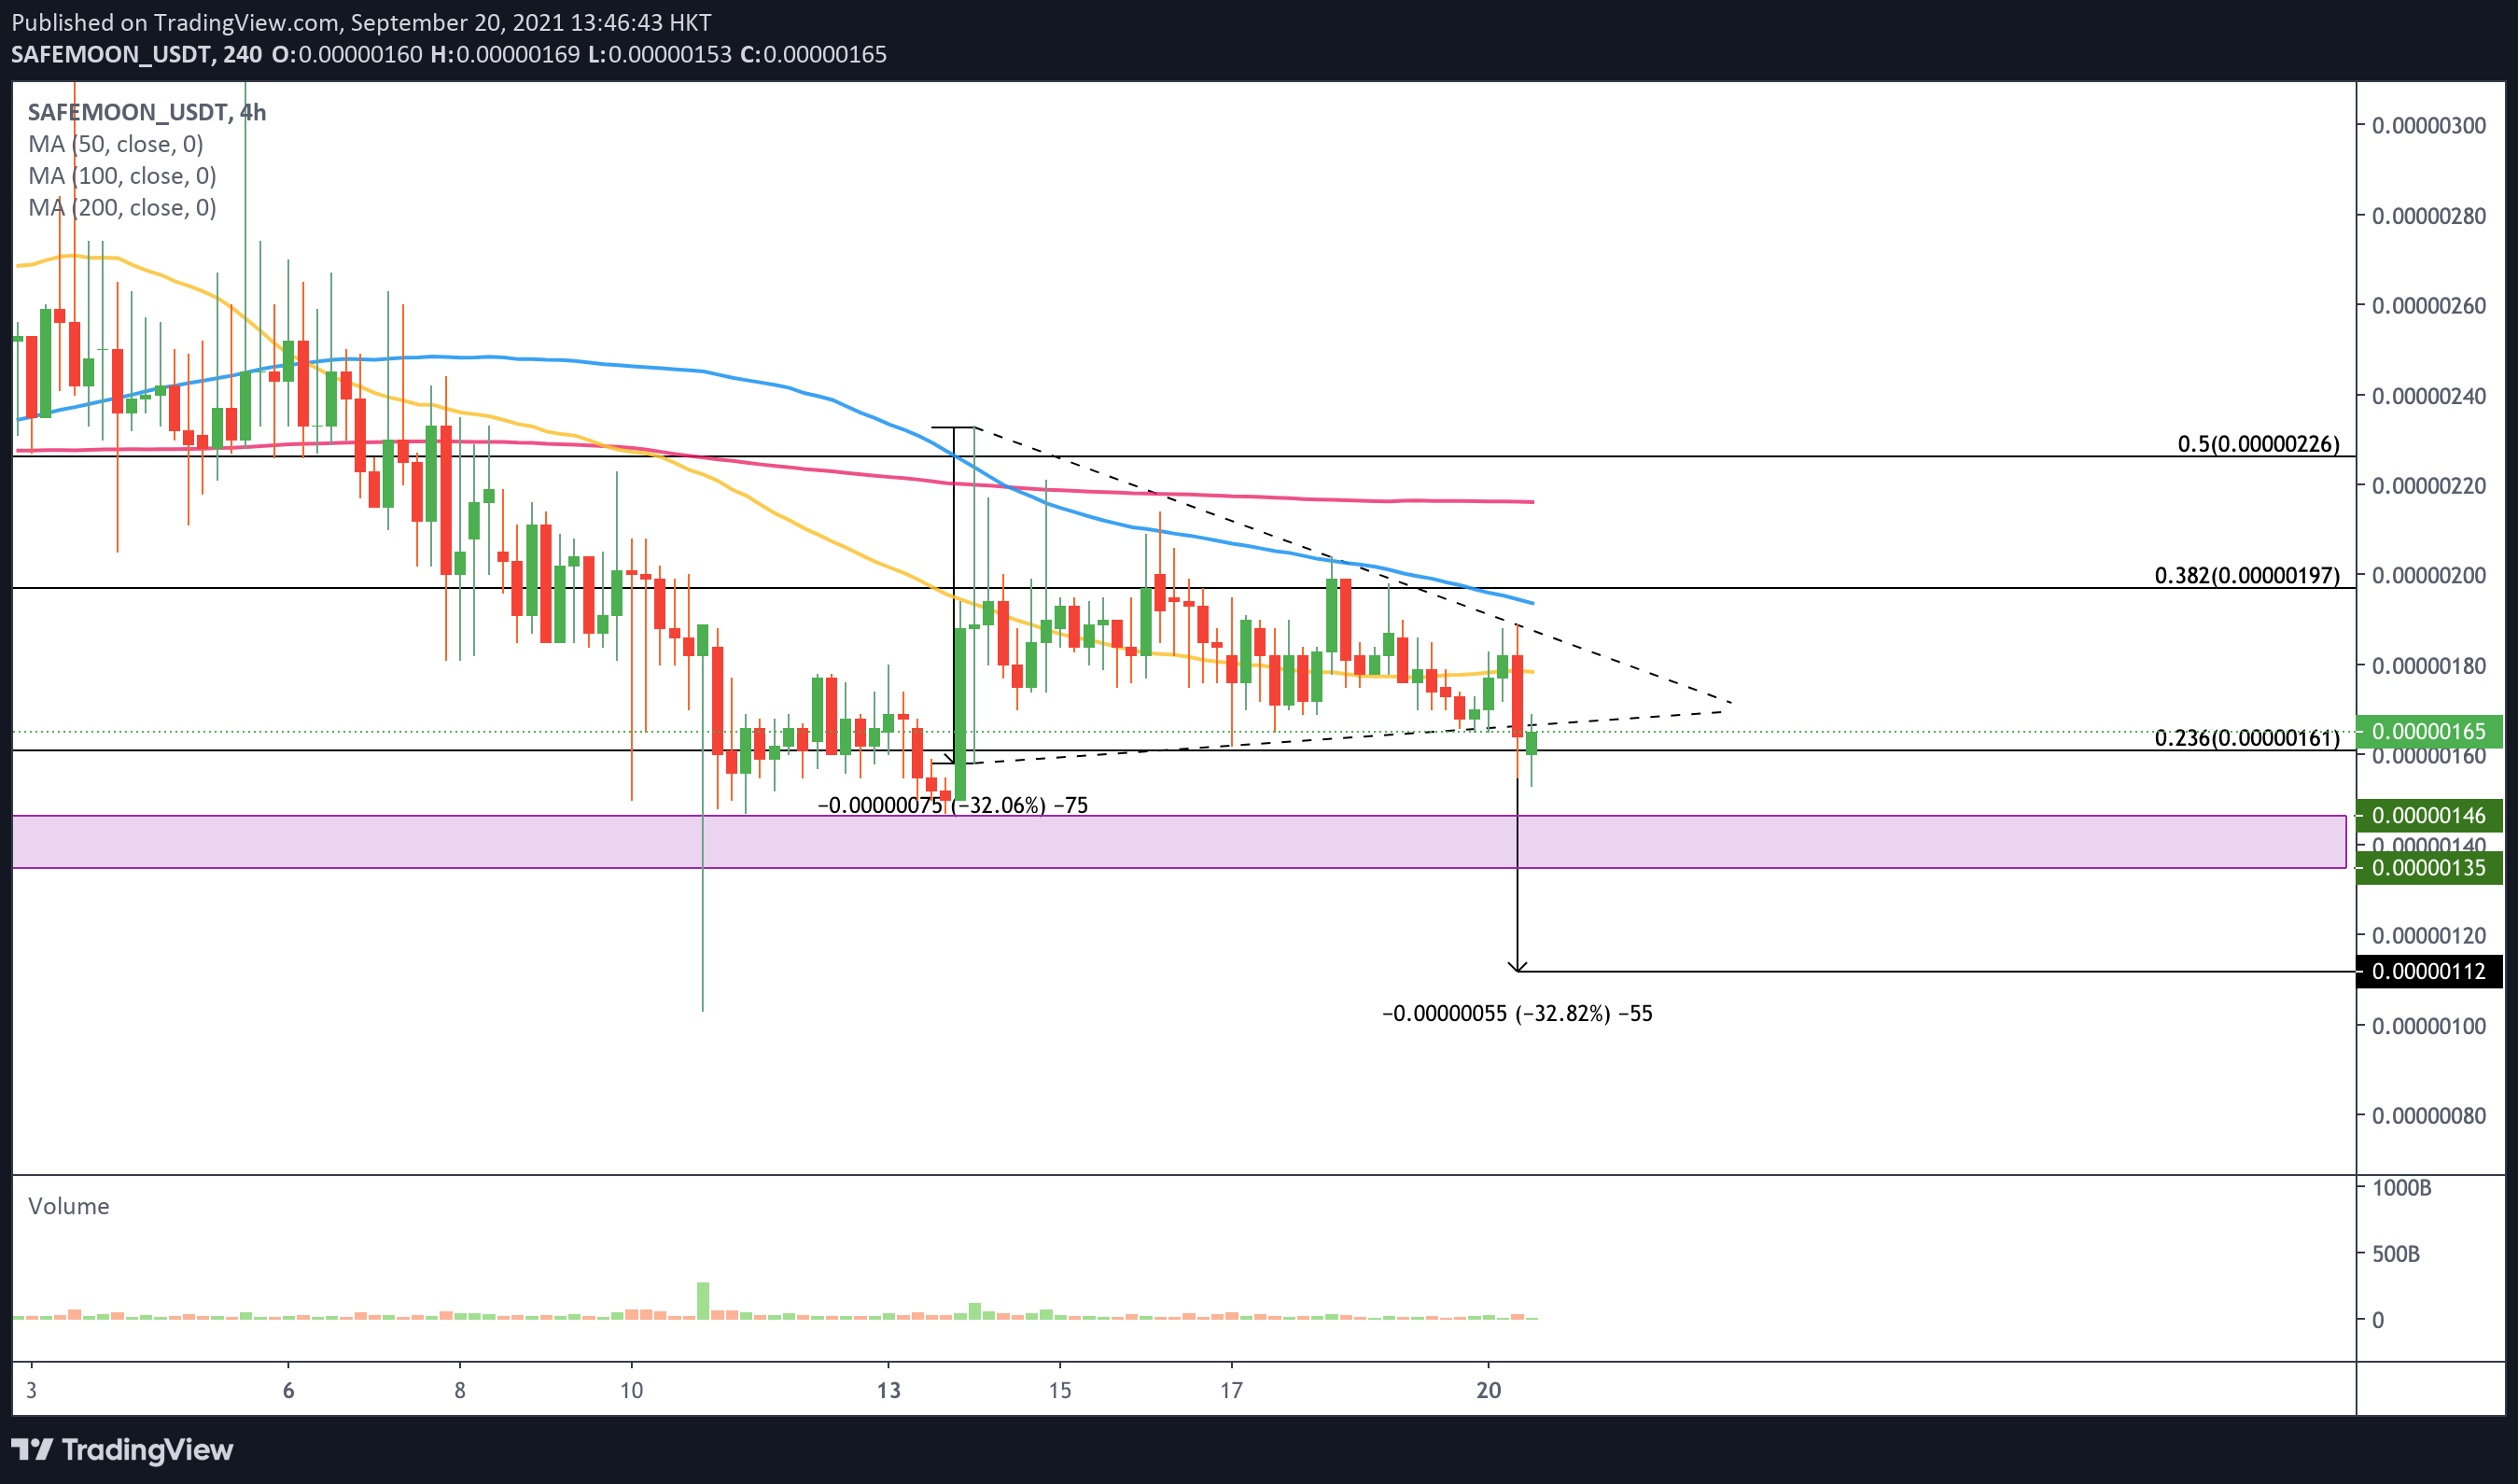
SAFEMOON/USDT 4-hour chart

The first line of resistance appears to be at the lower boundary of the triangle at $0.00000166. Should the bulls flip this level into support, the following target for the buyers is at the 50 four-hour Simple Moving Average (SMA) at $0.00000178. 

For the SAFEMOON bulls to reverse the period of underperformance, the buyers should aim to slice above the upper boundary of the symmetrical triangle at $0.00000187, which could take SafeMoon price out of the woods in the near term. 

The following hurdle for SafeMoon price would emerge at the 100 four-hour SMA at $0.00000194, then at the 38.2% Fibonacci retracement level at $0.00000197.


Note: All information on this page is subject to change. The use of this website constitutes acceptance of our user agreement. Please read our privacy policy and legal disclaimer. Opinions expressed at FXstreet.com are those of the individual authors and do not necessarily represent the opinion of FXstreet.com or its management. Risk Disclosure: Trading foreign exchange on margin carries a high level of risk, and may not be suitable for all investors. The high degree of leverage can work against you as well as for you. Before deciding to invest in foreign exchange you should carefully consider your investment objectives, level of experience, and risk appetite. The possibility exists that you could sustain a loss of some or all of your initial investment and therefore you should not invest money that you cannot afford to lose. You should be aware of all the risks associated with foreign exchange trading, and seek advice from an independent financial advisor if you have any doubts.

Join Telegram

Recommended content


Recommended Content

Editors’ Picks

Why crypto may see a recovery right before or shortly after Bitcoin halving

Why crypto may see a recovery right before or shortly after Bitcoin halving

Cryptocurrency market is bleeding, with Bitcoin price leading altcoins south in a broader market crash. The elevated risk levels have bulls sitting on their hands, but analysts from Santiment say this bleed may only be cauterized right before or shortly after the halving.

More Cryptocurrencies News

Manta Network price braces for volatility as $44 million worth of MANTA is due to flood markets

Manta Network price braces for volatility as $44 million worth of MANTA is due to flood markets

Manta Network (MANTA) price was not spared from the broader market crash instigated by a weakness in the Bitcoin (BTC) market. While analysts call a bottoming out in the BTC price, the Web3 modular ecosystem token could suffer further impact.

More Manta Network News

Bitcoin price uptrend to continue post-halving, Bernstein report says as traders remain in disarray

Bitcoin price uptrend to continue post-halving, Bernstein report says as traders remain in disarray

Bitcoin is dropping amid elevated risk levels in the market. It comes as traders count hours to the much-anticipated halving event. Amid the market lull, experts say we may not see a rally until after the halving. 

More Bitcoin News

OMNI post nearly 50% loss after airdrop and exchange listing

OMNI post nearly 50% loss after airdrop and exchange listing

Omni network (OMNI) lost nearly 50% of its value on Wednesday after investors dumped the token following its listing on top crypto exchanges. A potential reason for the crash may be due to the wider crypto market slump.

More Omni Network News

Bitcoin: BTC’s rangebound movement leaves traders confused

Bitcoin: BTC’s rangebound movement leaves traders confused

Bitcoin (BTC) price has been hovering around the $70,000 psychological level for a few weeks, resulting in a rangebound movement. This development could lead to a massive liquidation on either side before a directional move is established. 

Read full analysis

BTC

ETH

XRP