Ripple price suffers the aftermath of Hinman email failure as the XRP hype train dissipates
- Ripple price continues to paint bearish billboards with market capitalization, trading volume, and price in the red.
- The grin started after the Hinman documents release failed to deliver the expected frothing for the remittance token.
- Community members grow impatient after almost three years of waiting with the case still open, falling social dominance shows.

Ripple (XRP) price is bearish, suffering the aftermath of a prolonged or stalled case. The bearishness continues to grow days after the release of the Hinman emails, which though expected to blow out XRM market value, failed to deliver as many overflows as had been expected.
Ripple price falls in tandem with waning euphoria
Ripple (XRP) price corrected almost 10% on June 14, a day after the release of the Hinman emails. The documents were touted as crucial to Ripple’s defense against the US Securities and Exchange Commission (SEC). For this reason, in the days leading to pro-XRP attorney John Deaton’s promise to disclose them, the remittance token’s market value skyrocketed to levels seen last in late March at around $0.562. This was attributed to the “buy the rumor sell the news” mania.
Market players anticipated that the documents could help the payment giant in its lawsuit with the US financial regulator and possibly expedite a summary judgment. With no significant developments in the Ripple vs. SEC case almost a month after the emails were released, the XRP community has grown weary of the anticipation, as indicated by the lack of momentum in the Ripple market.
Data from CoinMarketCap indicates an approximately 50% decrease in trading volume over the last 24 hours. As volume can indicate market strength, a falling market with decreasing trading volume is typically viewed as weak and unhealthy. With Ripple price falling on decreasing volume, the trend continues to lose strength toward the downside, showing a lack of conviction.
Evidence of this is also seen in the fall in social dominance for the remittance token. This metric on Santinent shows that XRP has dropped from a monthly peak of 5.832% recorded on July 2 to the 0.598% level as of press time.
 [10.58.48, 08 Jul, 2023]-638244011092140845.png)
This represents an 89.75 percentage change in less than a week to the downside.
Ripple price waits for case development for a significant move
Ripple (XRP) price refuses to respond to positive network developments, including recent network plans to conceptualize tokenization with a foray into real estate.
#CBDCs are gaining traction globally and @Ripple CBDC team are focussing in on Real world use cases for a CBDC or #stablecoin. Last week I shared two real use cases at a CEE Fintech conference in Romania:#Tokenization is the Future of Real Estate
— Antony Welfare (@AntonyWelfare) July 7, 2023
· The pilot combines the… pic.twitter.com/OMe1ieq8d1
Despite Ripple Labs’ plans to transform tangible assets such as real estate, artwork, and intellectual property into digital tokens with guaranteed blockchain security storage, the XRP price remains red.
Notably, it has been approximately four months since the last ruling in the Ripple vs. SEC case, steadily drawing toward the 166 thresholds (average duration federal judges take before delivering summary judgment, research on civil case processing by federal courts conducted by the University of Denver shows.
Therefore, the XRP community could see Judge Analisa Torres deliver her ruling sometime in Q3 of 2023. Experts such as CryptoBull believe the judge has already taken too long, translating to growing impatience.
The fact that it takes Judge Torres this long to rule in the SEC vs #Ripple case hurts the people’s confidence in our Justice System.
— CryptoBull (@CryptoBull2020) June 23, 2023
We are now almost three months beyond the ruling date expected by many experts. This creates a negative perception in the #XRP community.
At the time of writing, XRP is auctioning for $0.467, a daily rise of 0.6% but still down 5% in the last two weeks and 10% in the last month.
With the Parabolic SAR indicators tracking Ripple price from above since June 27, XRP has been bearish for almost two weeks, catalyzed by falling buyer momentum indicated by the trajectory of the Relative Strength Index (RSI).
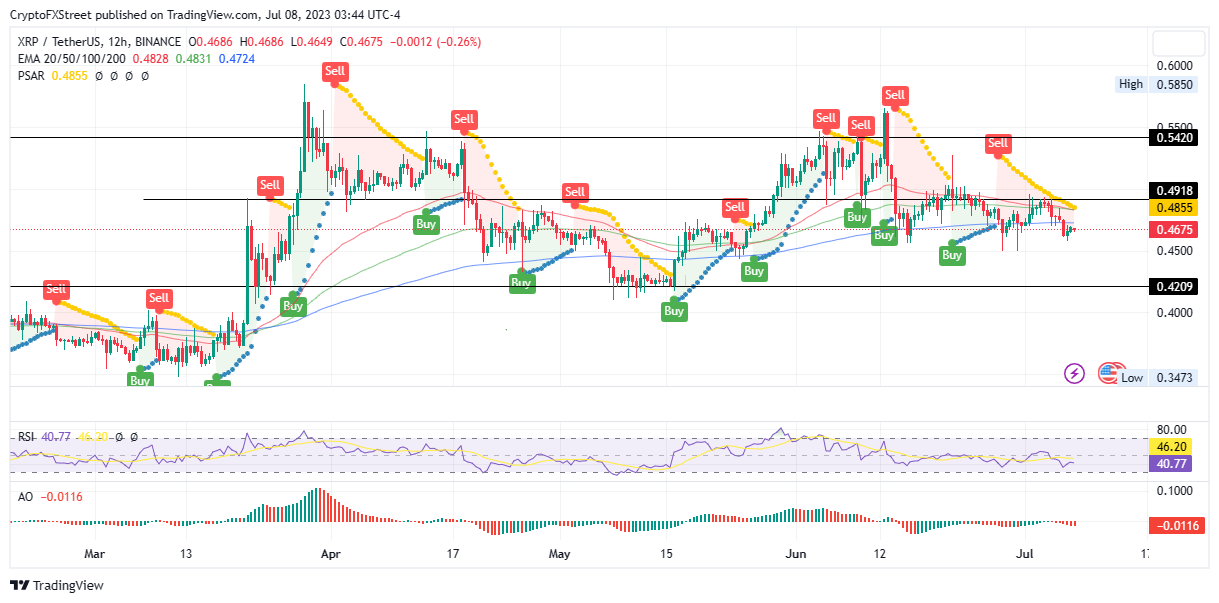
XRP/USDT 1-Day Chart
Like this article? Help us with some feedback by answering this survey:
Author

Lockridge Okoth
FXStreet
Lockridge is a believer in the transformative power of crypto and the blockchain industry.


