Ripple price primed for an upward breakout
- Ripple price breaks above its daily resistance level at $0.499 on Monday.
- On-chain data suggests XRP development activity is rising.
- A daily candlestick close below $0.450 would invalidate the bullish thesis.
Ripple (XRP) price broke above its daily resistance level of $0.499 on Monday.
On-chain data indicates that XRP’s development activity is rising, signaling that the bulls are preparing for their next move.
Ripple price looks promising
Ripple price rose 3.2% on Monday and closed above $0.499, its previous resistance level.
Currently, XRP faces a resistance at $0.515, its 50-day Exponential Moving Average (EMA).
If Ripple price finds support around $0.499 and breaks above the 50-day EMA at $0.515, it could rise 7% from $0.499 to $0.532, its previous high from June 5.
The Relative Strength Index (RSI) is below the 50 mean level, while the Awesome Oscillator (AO) is below its zero line. If bulls are indeed making a comeback, then both momentum indicators need to maintain their positions above their respective mean levels of 50 and 0. Such a development would add a tailwind to the recovery rally.
If the bulls are aggressive and the overall crypto-market outlook is positive, the XRP could extend an additional 9% rally to $0.581, a 50% price retracement level of $0.419 and $0.744 from March 11 to April 13.
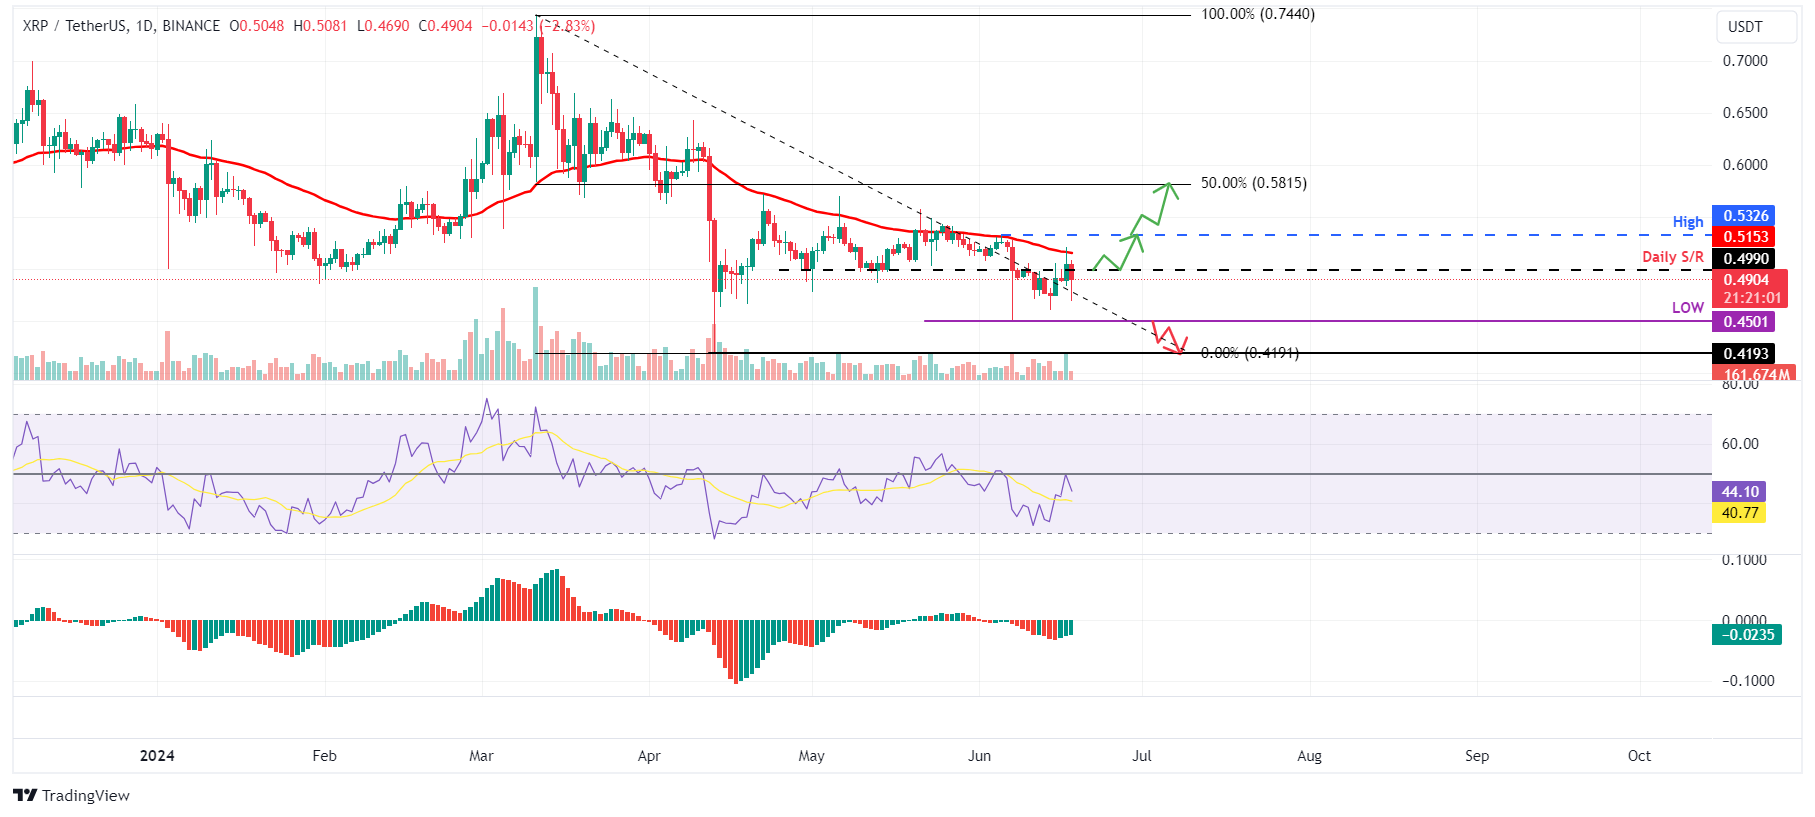
XRP/USDT 1-day chart
Santiment’s Development Activity metric tracks the frequency of project development events recorded in the public GitHub repository over time.
A rise in this metric usually suggests continuous endeavors to uphold, innovate, and improve the protocol, which is generally seen as favorable by investors and stakeholders.
Conversely, a decline in this metric might raise apprehensions about the project's endurance, capacity for innovation, and engagement with the community in the foreseeable future.
As in XRP’s case, the index rose from 10.29 on June 13 to 10.91 on June 17. The 6% rise in XRP’s Development Activity adds further credence to the bullish outlook.
%20[07.42.41,%2018%20Jun,%202024]-638542774432359990.png)
XRP Development Activity chart
Even though on-chain metrics and technical analysis point to a bullish outlook, if Ripple price produces a daily candlestick close below $0.450, the daily low from June 7, the move would invalidate the bullish thesis by making a lower low on the daily time frame. This development could see XRP's price decline 7% to the April 13 low of $0.419.
Author

Manish Chhetri
FXStreet
Manish Chhetri is a crypto specialist with over four years of experience in the cryptocurrency industry.


