Ripple Price Forecast: XRP holders need to prepare for 25% crash
- XRP price is on a downtrend, with no potential trend reversal signs in sight.
- Investors can expect the remittance token to trigger a 26% correction after a minor liquidity run to the upside.
- Invalidation of the bearish outlook will occur if Ripple bulls manage to flip the $0.532 hurdle into a support floor.
XRP price has been dull after the SEC vs. Ripple lawsuit details were ironed out. Since the July 13 verdict announcement, the altcoin has shed 50% to where it currently trades – $0.478. This price decline is expected to continue in the short term, with technical indicators pointing to an extended correction for the remittance token if it fails to overcome a key hurdle.
Also read: Gary Gensler is a hammer and everything looks like a nail: Ripple CEO Brad Garlinghouse
XRP price lacks momentum
XRP price saw a massive uptick in buying pressure after the SEC vs. Ripple lawsuit’s decision was announced on July 13. Since then, Ripple bulls have done nothing but flee, which has caused the altcoin to shed 50% of its value.
Currently, XRP price trades at $0.478, with the Relative Strength Index (RSI) scraping the oversold region at 30. The last two lows for RSI have produced a higher low, while Awesome Oscillator’s (AO) histogram below the zero line is receding, suggesting an increase in bullish momentum.
In contrast with the XRP price, this uptick in bullishness could trigger a recovery rally. However, the presence of the $0.519 and $0.532 hurdles is likely to limit the bounce from the current position to just 12%.
Rejection at these key levels is more than likely considering that these barriers have been relevant since March 2021. A spike in selling pressure, perhaps combined with bearish moves from Bitcoin price, could cause XRP price to crash up to 26% from these resistance barriers and tag the next key support levels at $0.409 and $0.392.
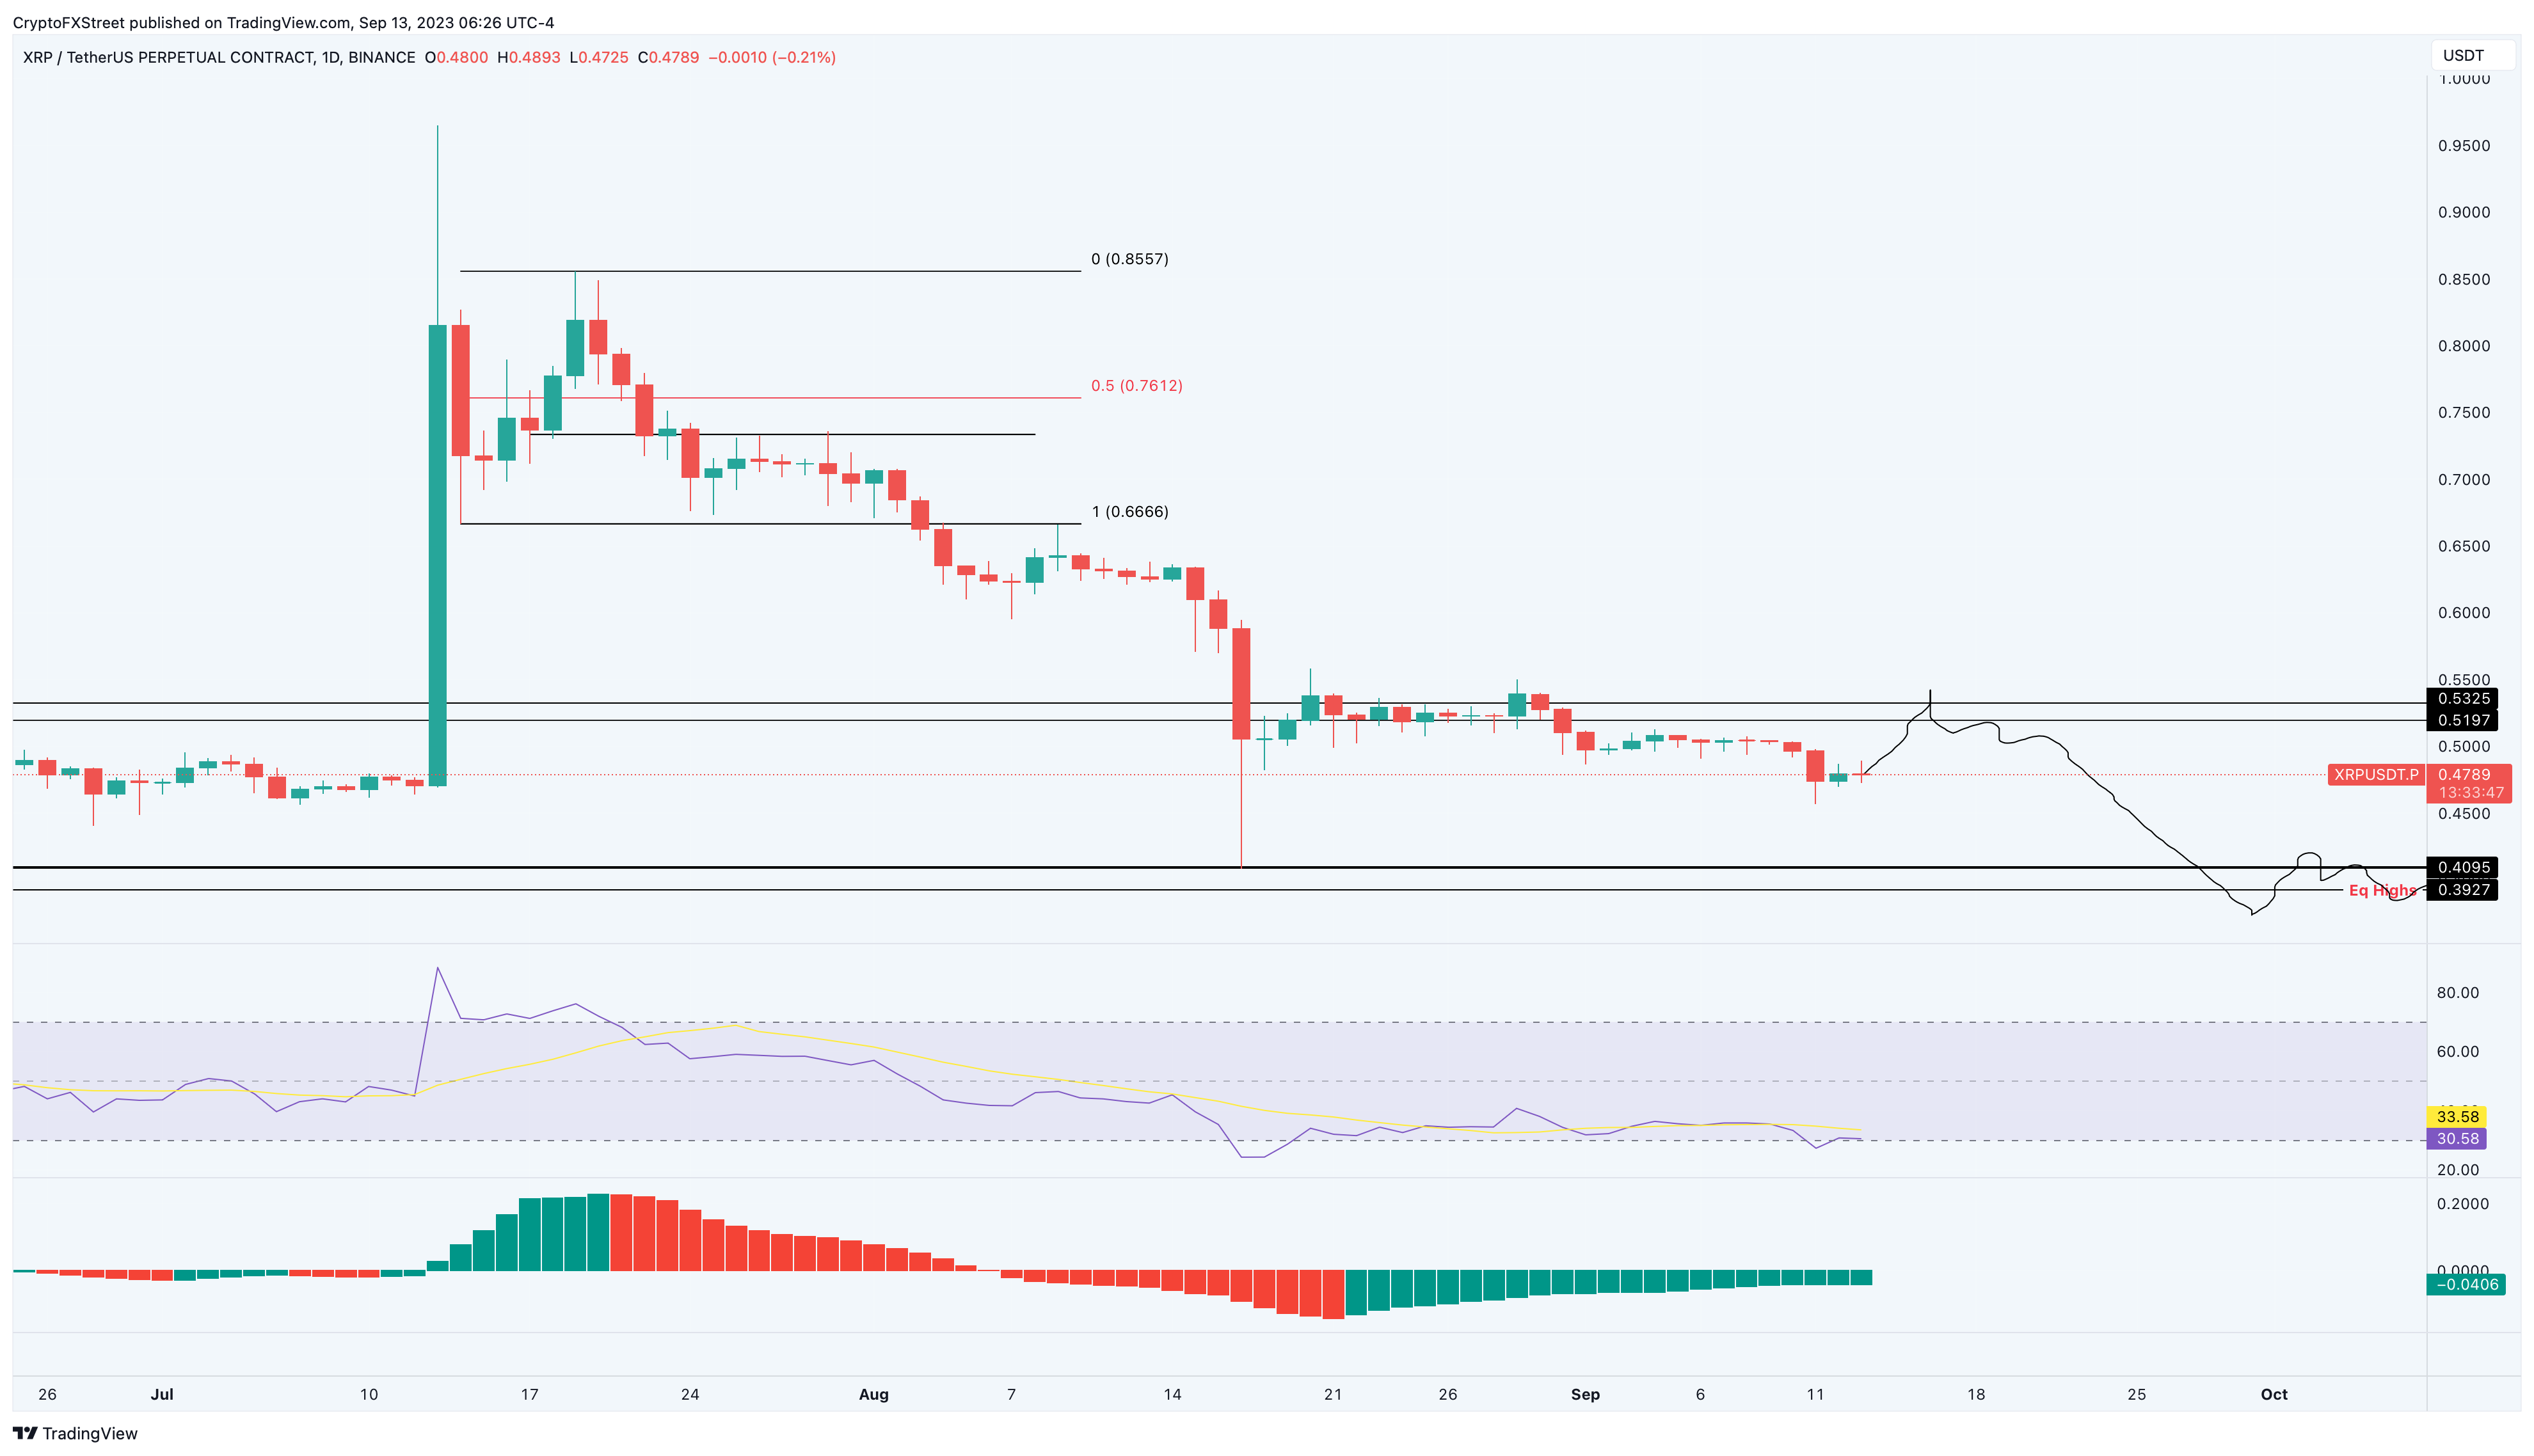
XRP/USDT 1-day chart
While the outlook for XRP price is bearish, investors need to pay attention to any daily candlestick close above the $0.532 hurdle. If this barrier is successfully flipped into a support floor that absorbs profit-taking from holders, it would invalidate the bearish thesis.
Such a development could push the remittance token up by 15% to tag the $0.595 hurdle.
Also read: US ‘the only country’s crypto startups should avoid, says Ripple CEO
Like this article? Help us with some feedback by answering this survey:
Author

Akash Girimath
FXStreet
Akash Girimath is a Mechanical Engineer interested in the chaos of the financial markets. Trying to make sense of this convoluted yet fascinating space, he switched his engineering job to become a crypto reporter and analyst.



