Ripple Price Forecast: XRP deals with lockstep trading amid weakening on-chain metrics
- Ripple seeks support above the 61.8% Fibonacci level on the four-hour chart, while bulls eye $0.6.
- Short-term analysis based on the MACD shows that consolidation could take precedence.
- Declining network growth, as highlighted by Santiment, is a bearish signal.

Ripple managed to hold onto support at $0.55 during the weekend session. However, the price action to $0.6 remained limited due to the seller congestion zone at the 78.6% Fibonacci level taken between the last high of $0.65 to a low around $0.36. If the immediate support remains intact, XRP bulls will concentrate on trading above $0.6.
Ripple stuck in consolidation
The four-hour Moving Average Convergence Divergence (MACD) indicator is holding within the positive region but remains horizontal. This implies that price action is sideways, and XRP remains relatively in a no-trade zone. If the MACD line (blue) crosses above the signal line, the cross-border token will gain traction for higher price levels.
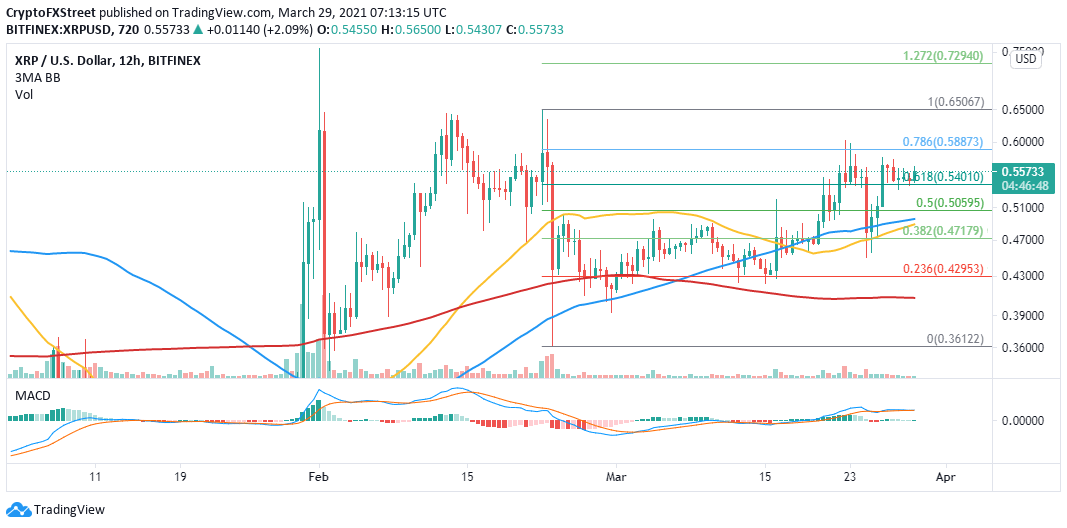
XRP/USD four-hour chart
The 50 Simple Moving Average (SMA) on the four-hour chart and the 100 SMA are sloping upward, signaling a persistent uptrend. A significant upswing will come into the picture if a golden cross pattern forms with the 50 SMA crossing above the 100 SMA. Besides, action beyond the 61.8% Fibonacci level is likely to trigger more buy orders as investors speculate for gains beyond $0.65.
Looking at the other side of the fence
Santiment, a behavioral and on-chain analytics platform, shines a light on the declining network growth. The number of addresses joining the network topped out at 3,303 on March 21 and has slumped to 2,244 at the time of writing, representing a 32% drop. Note that a falling network is a bearish signal because it interferes with the inflow and outflow of tokens within the network.
%20[10.31.11,%2029%20Mar,%202021]-637526051526379313.png)
Ripple network growth
Similarly, failing to hold above the 61.8% Fibonacci resistance level will open Pandora’s Box as losses come into play. On the other hand, failing to break above $0.6 would lead to a more extended consolidation period, as shown by the MACD on the four-hour chart.
Author

John Isige
FXStreet
John Isige is a seasoned cryptocurrency journalist and markets analyst committed to delivering high-quality, actionable insights tailored to traders, investors, and crypto enthusiasts. He enjoys deep dives into emerging Web3 tren


