Ripple market overview: XRP/USD brief surge reclaims $0.40 support
- Ripple is still trend trading above the trendline support in spite of the declines this week.
- XRP/USD is likely to close this week’s trading above $0.40.

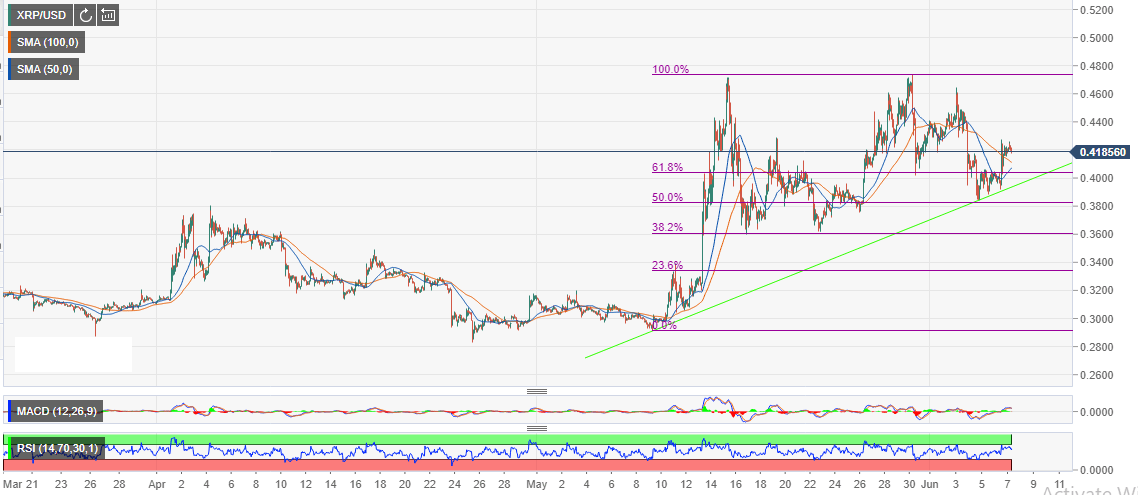
The 1-hour chart for XRP/USD trading pair shows that Ripple is still in an up trending phase. The second largest altcoin surged incredibly to $0.47 on May 16. Lack support at this level led to declines below $0.4. XRP/USD later found support at the 38.2% Fib level taken between the last swing high of $0.474 and a swing low of $0.2918 at $0.3600.
The price, however, did not stay down for as a reversal took place pushing Ripple in another expected bull rally. Just like the previous surge, the XRP/USD stalled at the same level of $0.47, which formed a double-top pattern. Reaction to this pattern culminated in more losses that have retested $0.3800 support in the first week of June.
Ripple is still trend trading above the trendline support. Moreover, the price is above both the 50 Simple Moving Average (SMA) and the 100 SMA. A recovery staged yesterday stepped past $0.4 support before extending the gains above $0.42 forming a high at $0.4285.
XRP/USD is likely to close this week’s trading above $0.40 while the weekend trading sessions are likely to send it above $0.44. The prediction will occur only if the MACD stays above the mean line amid increasing divergence. The RSI on the same chart is heading south after failing to breach its way into the overbought. Staying above 50 average mark will give more assurance that this reversal indeed has legs.
XRP/USD 1-hour chart
Author

John Isige
FXStreet
John Isige is a seasoned cryptocurrency journalist and markets analyst committed to delivering high-quality, actionable insights tailored to traders, investors, and crypto enthusiasts. He enjoys deep dives into emerging Web3 tren


