Reserve Rights Price Prediction: A 25% jump looms
- Reserve Rights price is facing a pullback after testing the 61.8% Fibonacci retracement level at $0.0100.
- On-chain data suggests that RSR development activity is growing.
- A daily candlestick close below $0.0057 would invalidate the bullish thesis.

Reserve Rights (RSR) price is facing a pullback to retest its support area before rallying further.
On-chain data suggest that the RSR development is growing, and prices could rally by 25%.
Reserve Rights price eyes for a 25% rally
Reserve Rights price is retracing toward the $0.0075 pullback after a rejection at the 61.8% Fibonacci retracement level at $0.0100, drawn from a swing high of $0.0133 on March 26 to a swing low of $0.0047 on April 13. If RSR bounces off from the said support level, it could rally 25% and tag the resistance level of $0.0094.
The Relative Strength Index (RSI) and Awesome Oscillator (AO) indicators are yet to retest their respective mean levels of 50 and 0. If the bullish momentum is strong, it could defend the $0.0075 support level, leading to a bounce in the RSI and AO indicators. This development would confirm the persistence of the uptrend narrative.
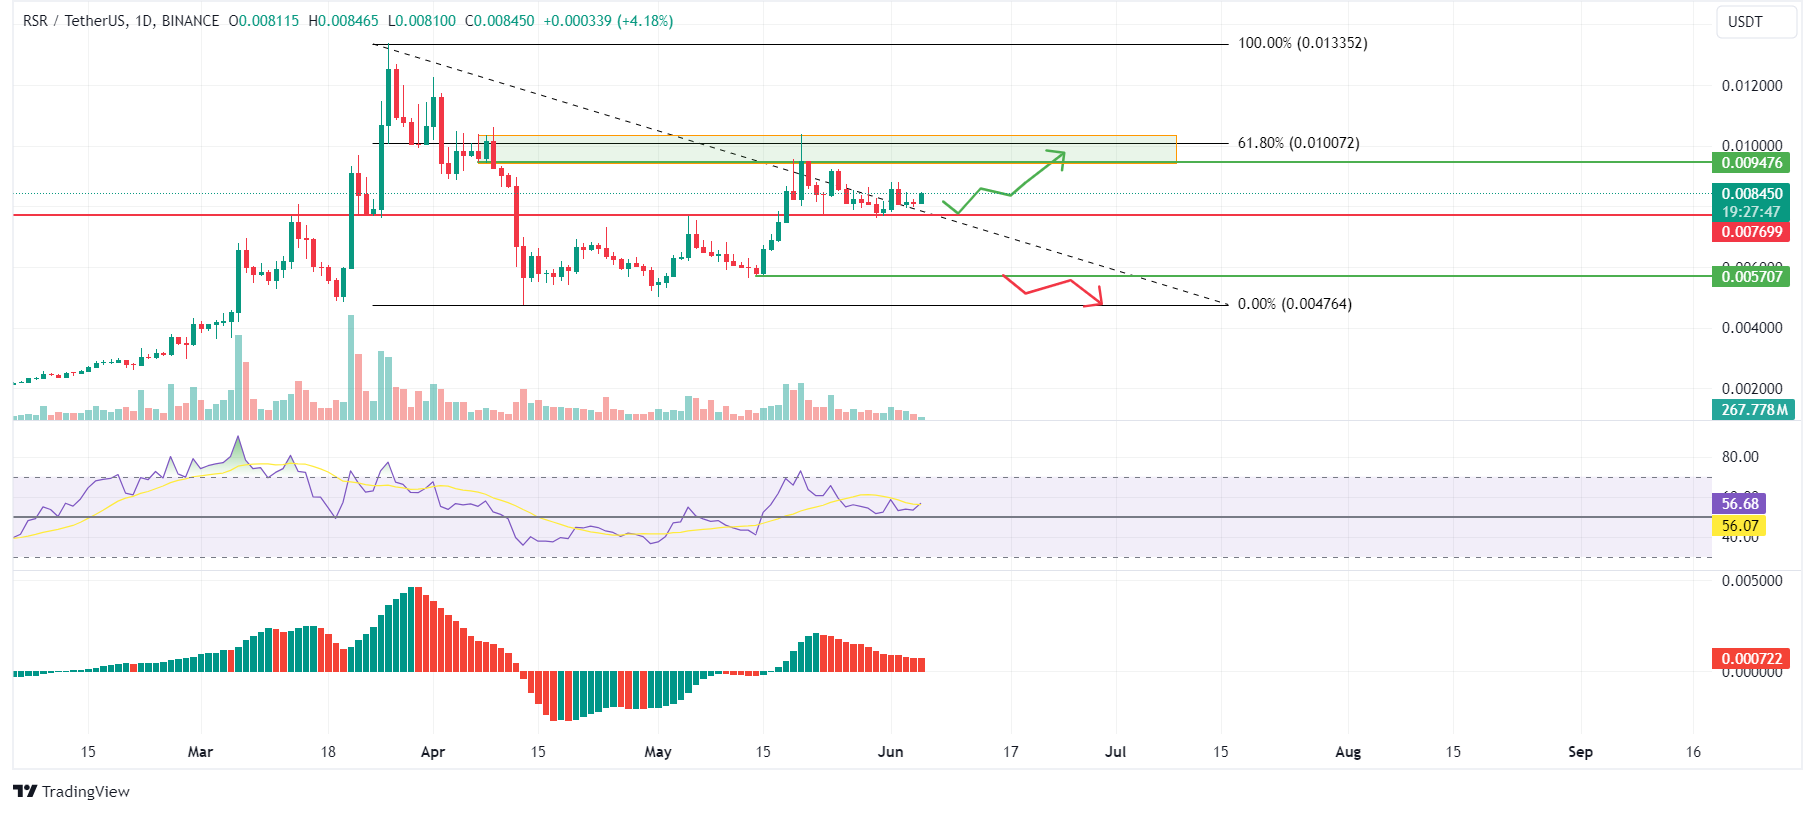
RSR/USDT 1-day chart
Based on IntoTheBlock's In/Out of the Money Map (IOMAP), nearly 455 addresses accumulated 3.15 billion RSR tokens at an average price of $0.0080. These investors bought RSR between $0.0079 and $0.0082, and are likely to accumulate more if the price dips into the area.
The $0.0075 support level mentioned from a technical analysis perspective coincides with the IOMAP findings, making this zone a key reversal zone to watch.
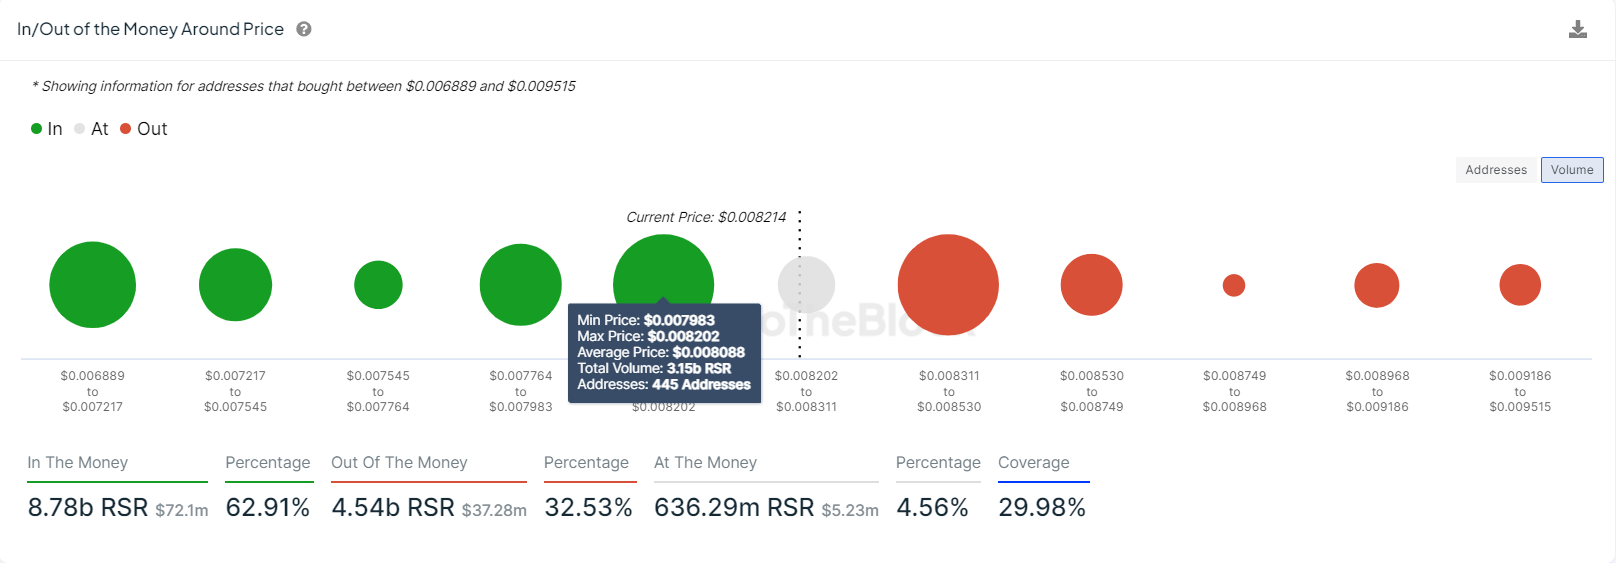
RSR IOMAP chart
Santiment’s Development Activity index shows project development activity over time based on a number of pure development-related events in the project's public GitHub repository. In RSR’s case, a sharp rise in the index from 1.21 on May 29 to 3.09 on June 5, implies that the Reserve Rights developing activity is high, which adds further credence to the bullish outlook.
%20[07.56.32,%2005%20Jun,%202024]-638531594506617071.png)
RSR Development Activity chart
Despite the bullish thesis signaled by both on-chain data and technical analysis, if the RSR daily candlestick breaks below $0.0057, the outlook would shift to bearish. This scenario could lead to a crash of 17% to $0.0047, which is the swing low of April 13.
Author

Manish Chhetri
FXStreet
Manish Chhetri is a crypto specialist with over four years of experience in the cryptocurrency industry.


