Binance coin price poised to break all-time high after recent surge
- Binance coin price is squeezed between the trendlines of an ascending triangle pattern.
- On-chain data suggests BNB network and activity are growing.
- A daily candlestick close below $500 would invalidate the bullish thesis.

Binance coin (BNB) aims for a fresh all-time high (ATH) above $692 as price action consolidates in a bullish ascending triangle pattern. On-chain data suggest increasing activity in BNB's network.
Binance coin price ready for triangle breakout
Binance coin price has produced four higher lows and four roughly equal highs since May 16. Connecting these swing points using a trend line reveals an ascending triangle formation in the daily chart. This technical pattern has a bullish bias, and the target is obtained by measuring the distance between the first swing high and the swing low to the breakout point.
Adding the 22% measurement to the potential breakout level of $645.7 reveals a target of $775, a new ATH. Investors should be cautious of this theoretical move as it could face a slowdown at BNB’s current ATH of $692.7. However, since the Relative Strength Index (RSI) and Awesome Oscillator (AO) indicators are firmly above their respective mean values of 50 and 0, the chances of the aforementioned slowdown are unlikely.
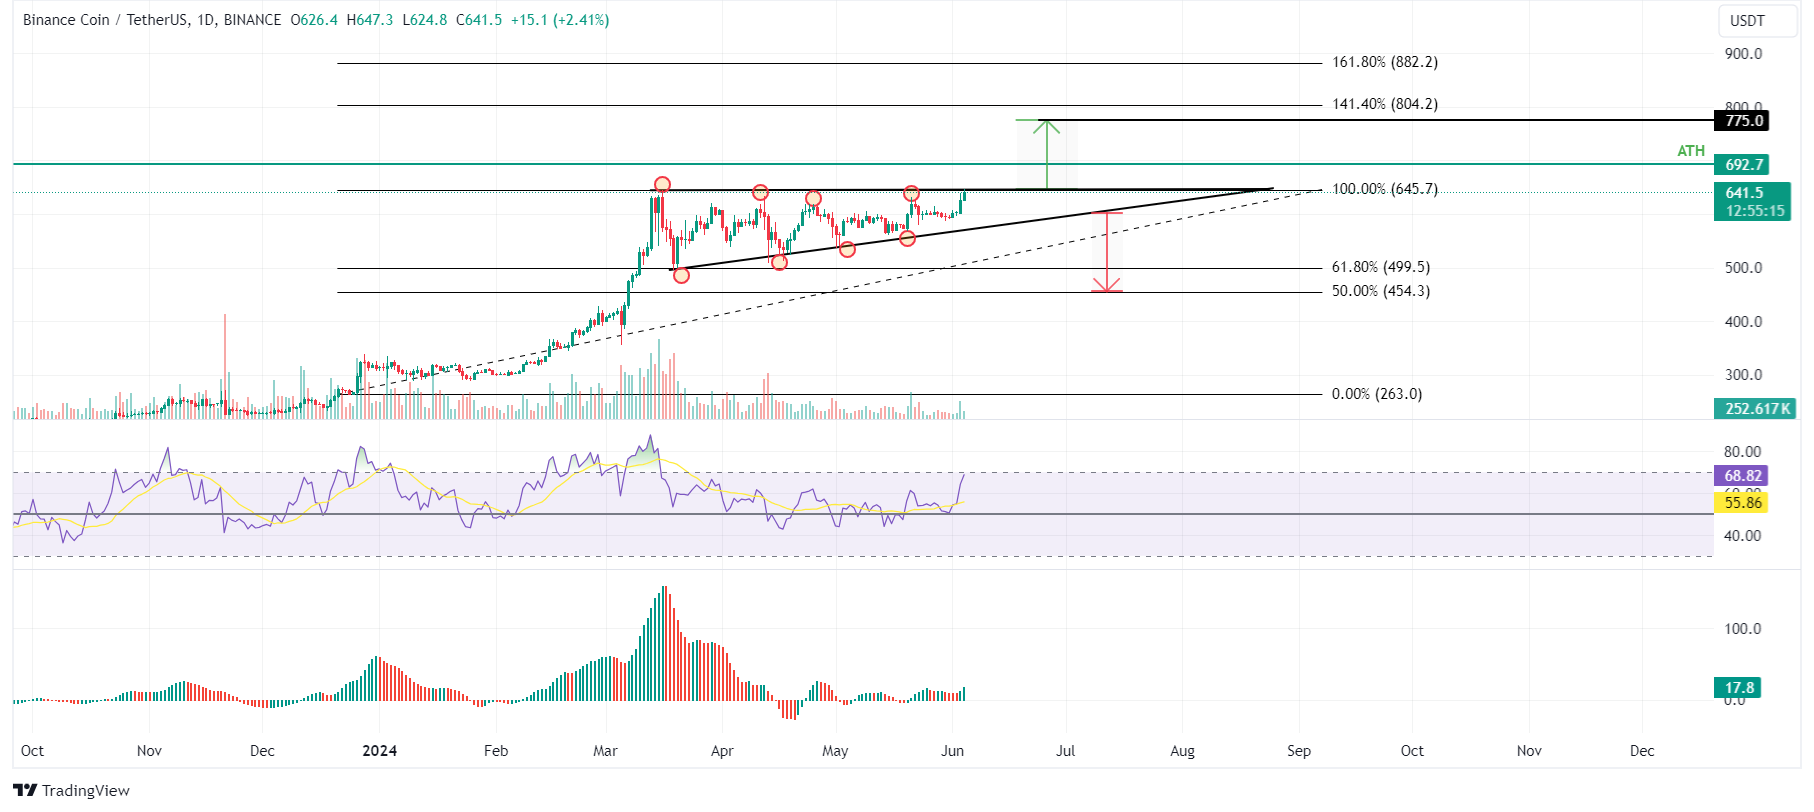
BNB/USDT 1-day chart
Data from BscScan BEP-20 Daily Token Transfer indicates the number of BEP-20 tokens transferred daily. A spike in this metric indicates that the network is growing and gaining traction.
In BNB’s case, the Daily Token Transfer increased from 6.62 million to 10.29 million from May 19 to June 3. This 56% increase implies a growing demand for the BNB network, which adds further credence to the bullish outlook.
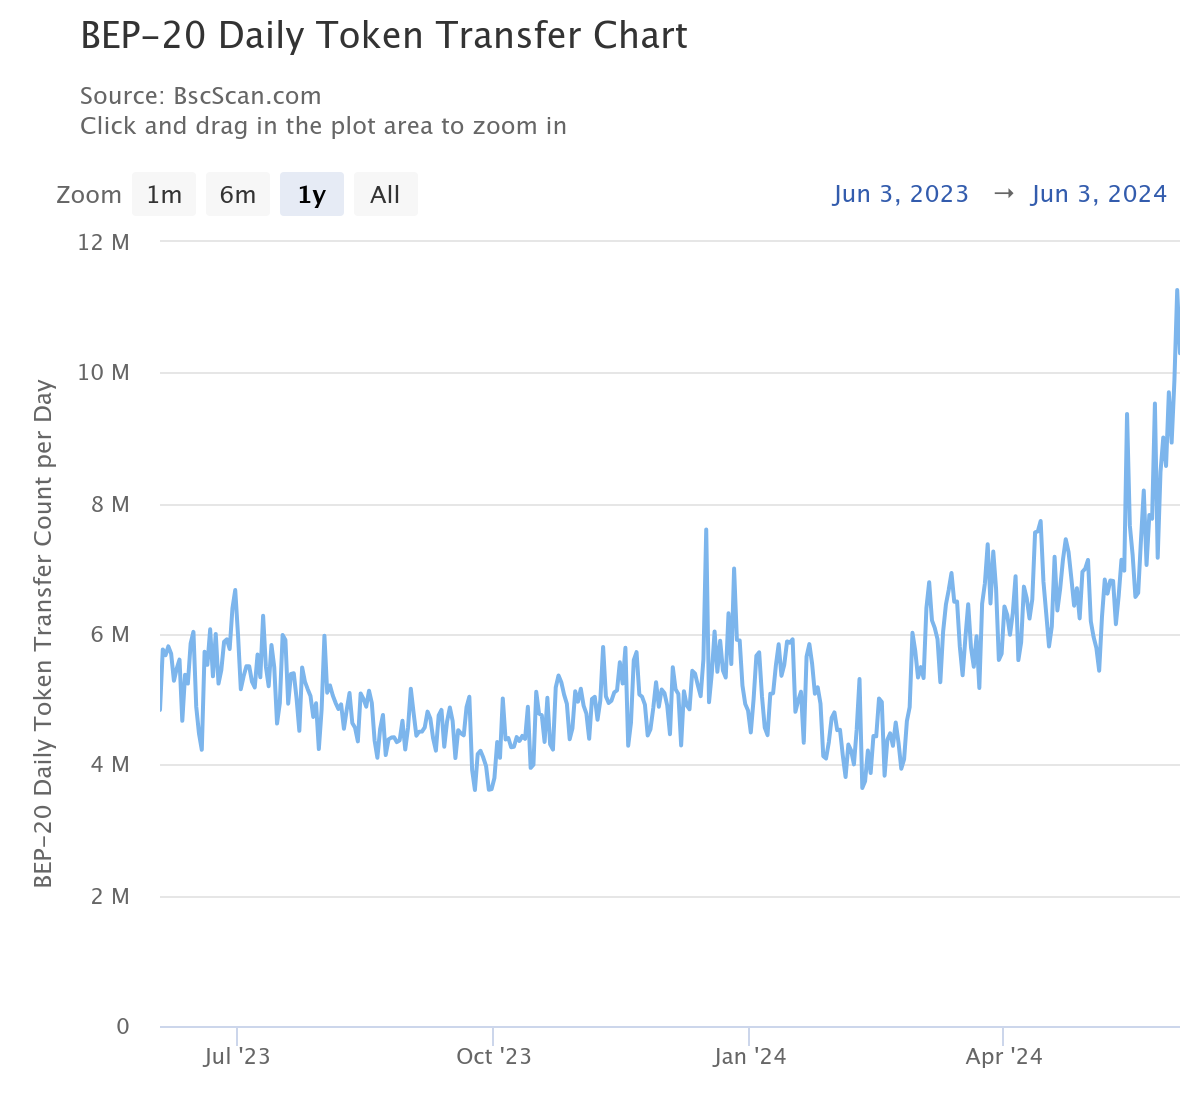
BEP-20 Daily Token Transfer chart
The BscScan BNB Smart Chain Unique Addresses chart metric only counts every active address just once, implying that even if a wallet makes multiple transactions inside a 24-hour span, its contribution to the indicator will still remain only one unit.
As in BNB’s case, the metric has constantly increased on an average of 150,000 unique addresses daily, indicating greater BNB Smart Chain usage and new capital coming into the network.
-638530964072843854.png)
BNB Smart Chain Unique Addresses chart
Despite the bullish thesis signaled by both on-chain data and technical analysis, if BNB breaks the upward trendline of the triangle and closes below $500, the outlook would shift to bearish. This scenario could lead to a crash of 9% to $454, which is the 50% Fibonacci retracement support level.
Author

Manish Chhetri
FXStreet
Manish Chhetri is a crypto specialist with over four years of experience in the cryptocurrency industry.



