Render price could rally 20%, supported by Nvidia stock split
- Render price looks set to rally if it retests the support zone extending from $9.42 to $8.82.
- The Nvidia stock split on June 10 could positively impact RNDR, an AI-based altcoin.
- On-chain data suggests whales are accumulating RNDR tokens.
- A daily candlestick close below $6.84 would invalidate the bullish thesis.

Render’s (RNDR) price could increase by around 20% propelled by the upcoming Nvidia (NVDA) stock split, according to technical and on-chain indicators. The AI-based altcoin is likely to face an initial pullback after struggling multiple times with daily resistance at $11.23 but falling to a key support area, the push from the AI narrative and bullish signs from large-wallet investors make it likely for RNDR to recover in the medium term.
Nvidia stock split news could uplift AI tokens
Nvidia stock has set new highs after announcing $6.1 billion in earnings on May 22.
On June 10, NVDA will have a 10:1 stock split. If it flips Apple's (AAPL) market capitalization, this could have an effect on crypto markets, with capital shifting from meme coins to AI-related tokens.
This might be a significant market mover for AI-related altcoins, like Render (RNDR), Fetch.ai (FET) or The Graph (GRT). These tokens have all benefited from the chipmaker's recent streak of strong earnings.
Render eyes for 20% gains
Render price is currently being rejected by the $11.23 daily resistance level. It has attempted multiple times to break this resistance but has failed to do so, and RNDR could experience a further pullback.
Investors looking for buying opportunities can do so at the zone extending from $9.42 and $8.82, which aligns with the Fibonacci retracement levels of 50% and 61.8%, respectively, drawn from the swing high of $11.95 on May 22 to the swing low of $6.84 on May 1.
Assuming that RNDR bounced off from the $9.42 level, then the price could rally 20% to test its recent high of $11.23.
If bulls are aggressive, RNDR could extend the rally by another 17% to its weekly resistance level at $13.16.
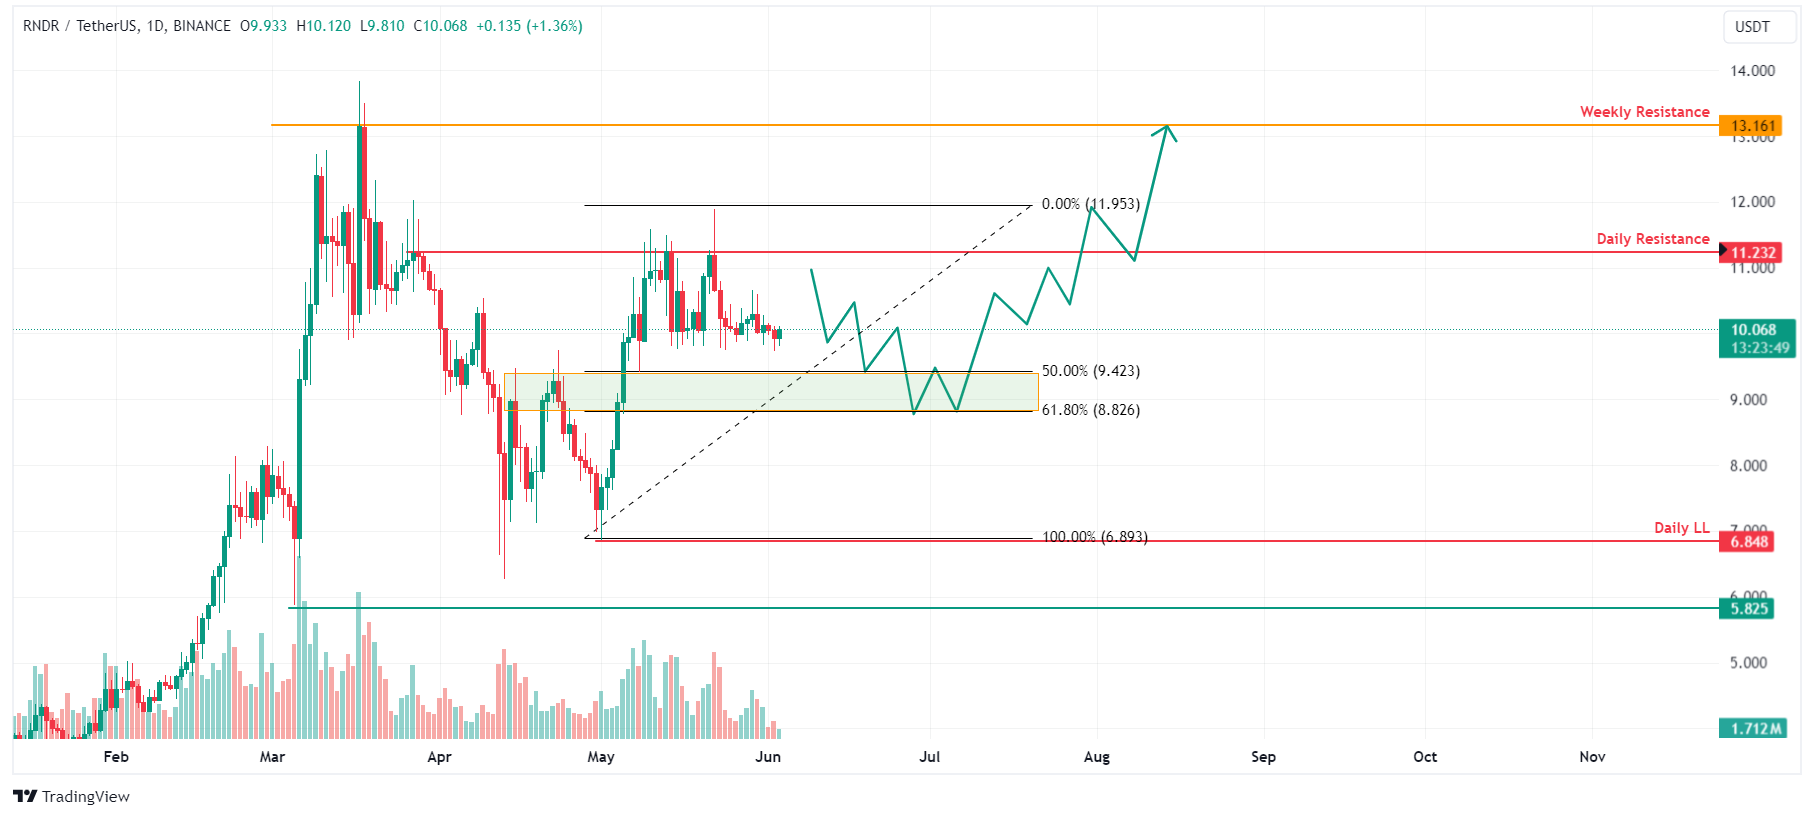
RNDR/USDT 1-day chart
IntoTheBlock's Large Holders Netflow metric indicates how whales and investors with over 0.1% of supply change their positions. In short, spikes in net flows can be seen as accumulation from large players, while drops point to reduced positions or selling.
In RNDR’s case, a spike in the index was seen between May 29 and 30. Netflow on May 29 was 1.08 million RNDR tokens, and on May 30, it was 10.03 million RNDR tokens. This sharp increase in whale accumulation indicates significant buying activity and may imply bullish price momentum.
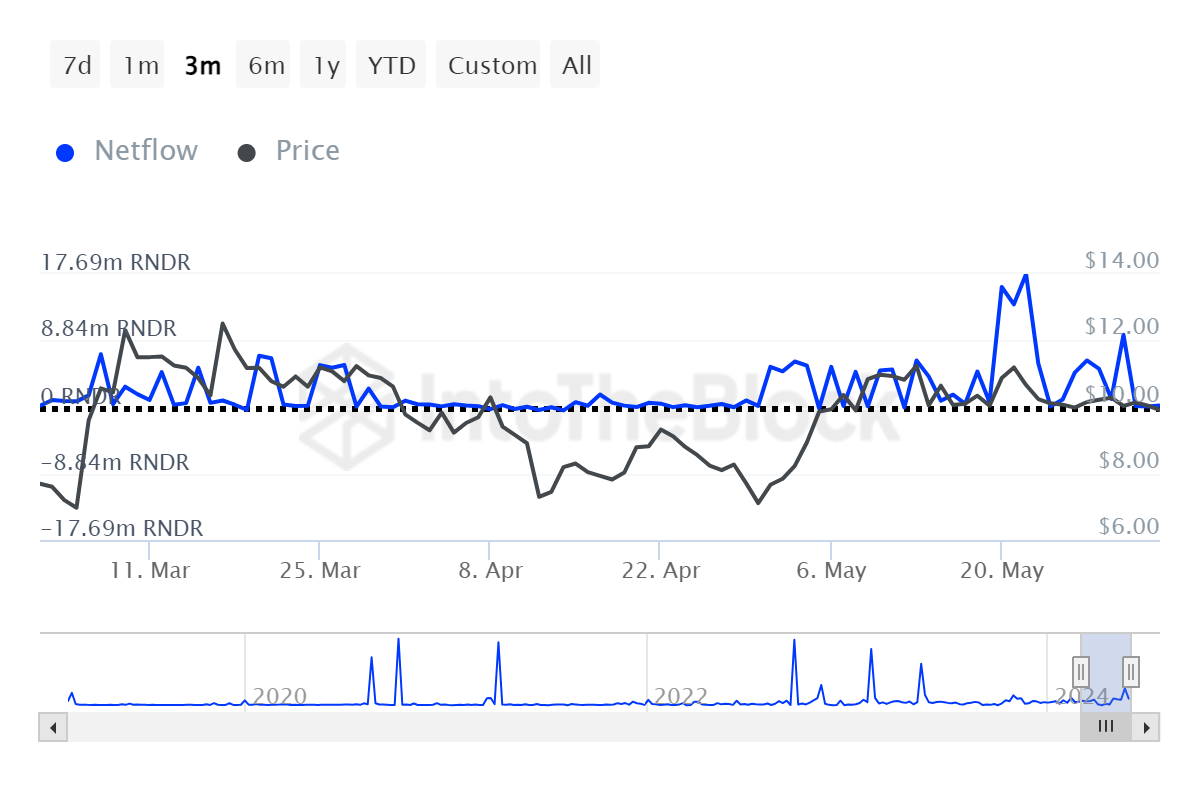
RNDR Large Holders Netflow chart
Santiment’s 30-day Market Value to Realized Value (MVRV) index determines the average profit or loss of investors who purchased tokens over the last 30 days and gives an idea of how much overvalued or undervalued an asset is.
A positive and higher MVRV value indicates more investors are in profit, thus signaling a higher willingness to sell.
On the contrary, a negative MVRV value indicates that the asset is "undervalued" on average. If all coins were sold, most traders would realize losses at the current price.
As in RNDR case, we see that the MVRV ratio is at -4.38%, indicating that the Render price is undervalued and investors are less likely to sell.
%20[14.45.16,%2003%20Jun,%202024]-638530163978188735.png)
RNDR 30-day MVRV ratio chart
Despite strong technical analysis and on-chain data, if the daily candlestick closes below $6.84, then the Render price will form a lower low and signal a break in the market structure. Thus, the bullish thesis would be invalid, leading RNDR to crash 15% to the previous support level of $5.82.
Author

Manish Chhetri
FXStreet
Manish Chhetri is a crypto specialist with over four years of experience in the cryptocurrency industry.


