Render price uptrend likely not over amid AI crypto coin euphoria
- Render price has soared almost 50% in less than two weeks as the AI crypto coin narrative drives markets.
- RNDR could extend the gains 15% to $7.0000 as AI tokens take center stage ahead of Nvidia earnings.
- The bullish thesis will be invalidated upon a break and close below the 61.8% Fibonacci at $4.7330.

Render (RNDR) price is trading with a bullish bias, recording a series of higher highs and higher lows since the last week of January. From a technical and on-chain perspective, the upside potential for the AI crypto coin may not be over just yet as AI tokens rally ahead of Nvidia earnings.
Also Read: AIT, GRT, OCEAN: Crypto data coins see massive rally alongside Bitcoin and AI tokens
Render eyes $7.0000 psychological level
Render (RNDR) price has soared almost 50% since February 7 before a rejection from the peak of the market range at $6.4350. However, with AI tokens currently taking center stage, the bulls could have a second chance at the roadblock with the potential to boulder through.
The Relative Strength Index (RSI) remains northbound despite RNDR being overbought, suggesting momentum is still rising. This is accentuated by the strong presence of the bulls in the RNDR market, seen with the large volumes of green histogram bars of the Moving Average Convergence Divergence (MACD) and the Awesome Oscillator (AO) in positive territory.
The MACD is also moving above its signal line (orange band) suggesting a new bullish cycle is looming. If the bulls make another go at the roadblock, Render price could shatter past it to hit the $7.0000 psychological level, nearly 15% above current levels.
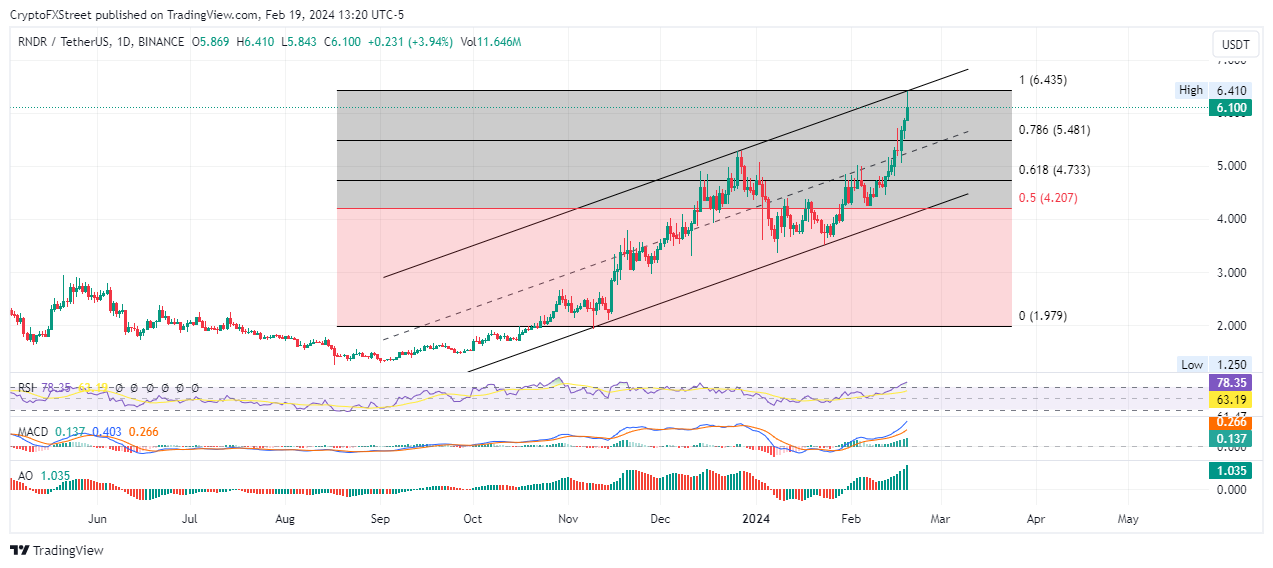
RNDR/USDT 1-day chart
On-chain metrics support Render price bullish outlook
Data according to Santiment’s daily active addresses metric shows that between February 14 and 19, 167 new or unique addresses have been created for RNDR, moving from 1,141 to 1,308. This points to increasing crowd interaction, which is bullish.
Social dominance and social volume metrics have decreased, however, which is bullish, according to Santiment analysts, who write, “a dangerously low amount of discussions about the asset allows the rest of crypto to surge,” adding, “The times in which crypto is most prone to downturns is when altcoins and sh**coins are the projects traders are actively focused on.”
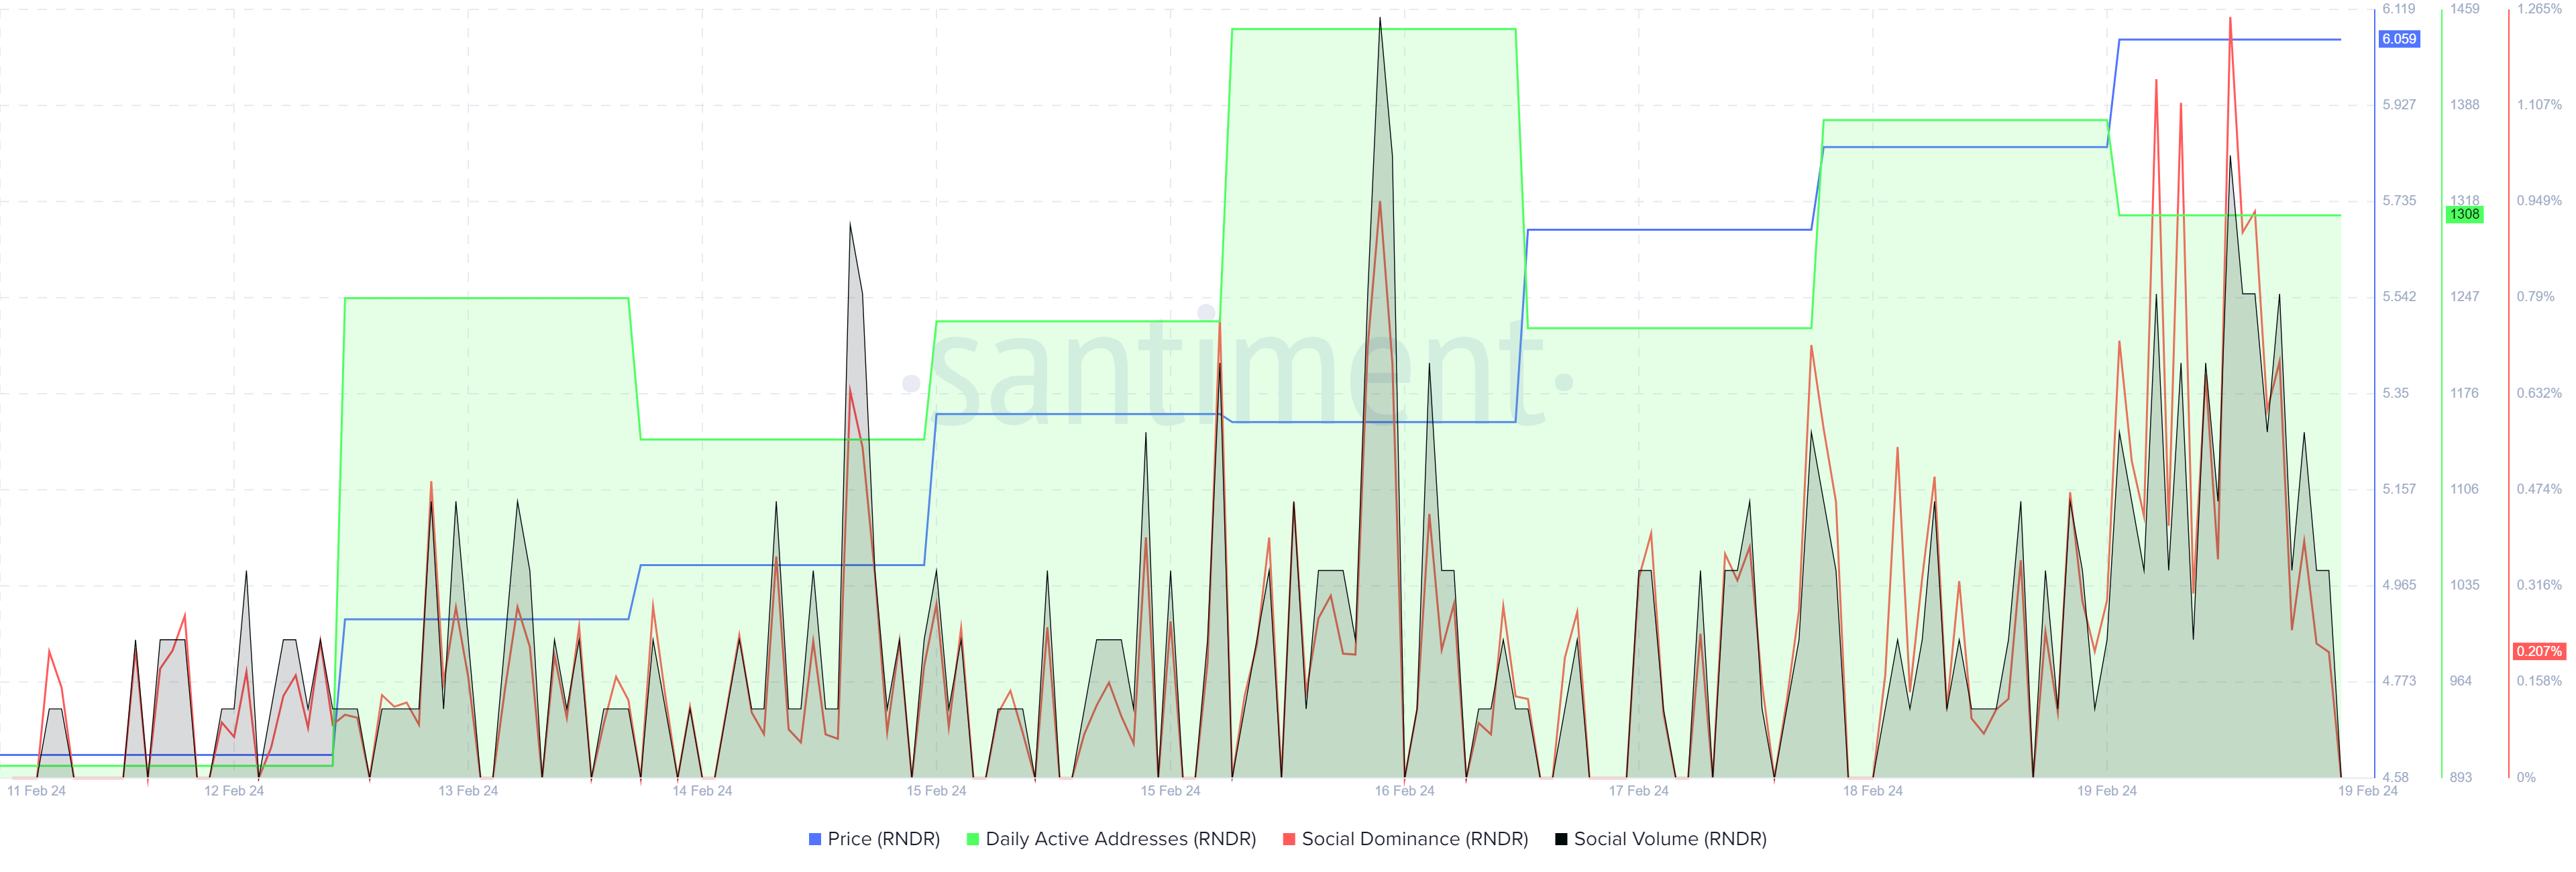
RNDR Santiment: Daily active addresses, social dominance, social volume
In addition, the volume of transactions metric has recorded a significant spike, moving 139.63 million to 265.14 million between February 17 and 19. This represents almost a 90% surge in less than two days. Coupling this with the drop in supply of exchange from 15.58 to 15.48 in two days, lesser and lesser traders are inclining toward selling RNDR, pointing to reduced short-term sell pressure on the asset.
Meanwhile, the exchange flow balance metric is negative, indicating that more RNDR tokens have flowed out of exchanges than in, translating to a reduced intention to sell.
 [21.12.54, 19 Feb, 2024]-638439681871643185.png)
RNDR Santiment: Volume, Exchange flow balance, Supply on exchanges
On the other hand, if traders start cashing in on the 50% gains, Render price could drop, likely retracing the 78.6% Fibonacci level of $5.4810. In a dire case, the slump could send the AI crypto coin to the 61.8% Fibonacci level of $4.7330, nearly 25% below current levels. A break and close below this level would invalidate the bullish thesis, likely sending RNDR to the 50% Fibonacci level at $4.2070.
Author

Lockridge Okoth
FXStreet
Lockridge is a believer in the transformative power of crypto and the blockchain industry.



